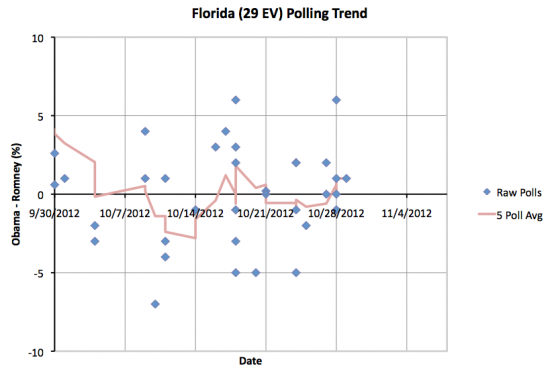
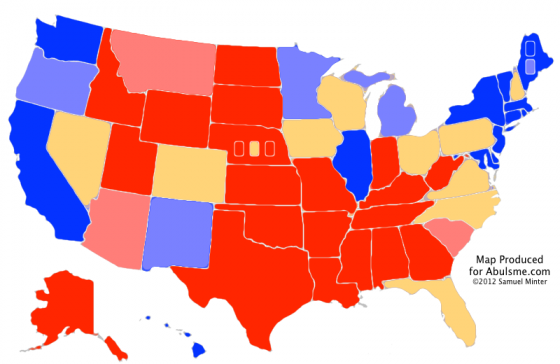
One state changes categories today. It is Florida.
As I’ve cautioned before with Florida (and a couple other states), the state is close, the five poll average has bounced back and forth across the line repeatedly. The average today moves slightly to the Obama side of the line. But it could easily go back to the Romney side of the line tomorrow. There have been no moves that indicate Florida is moving definitively toward one candidate or the other. Absent such a move in the next few days, we’ll basically just need to wait for the actual vote count.
So, new map and summary:
| Romney | Obama | |
|---|---|---|
| Romney Best Case | 321 | 217 |
| Current Status | 206 | 332 |
| Obama Best Case | 190 | 348 |
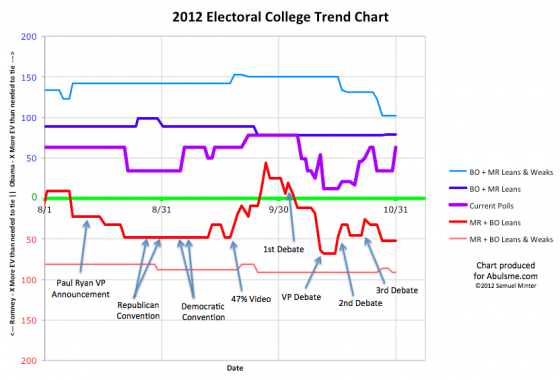
Hello old friend, it is nice to see you again! Once again we have a 332-206 Obama victory, which is where the “Current Status” line has been more often than anywhere else all year long. There have been moves above this, and moves below this, but so far, things have always come back here. I guess we’ll see if that holds through election day.
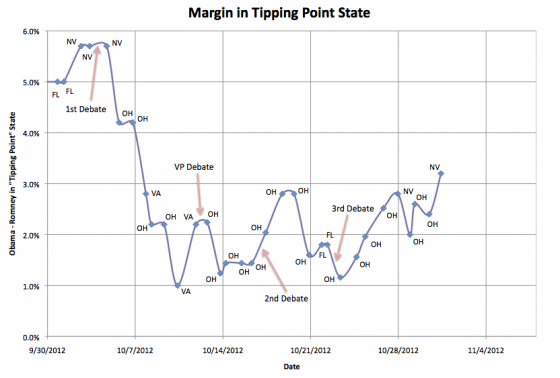
Once again though, lets dig deeper. Winning is possible for Romney here. But just how far away is he? Lets look again at the “Tipping Point Margin” chart I debuted yesterday:
What looked like a slight trend in Obama’s direction looks more significant today. With today’s update Obama’s lead in Ohio increased to 3.3%. This actually moved Ohio past Nevada, where Obama’s margin is now 3.2%. This makes Nevada the new “tipping point state”. Romney’s easiest path to victory is now holding on to all the areas he is ahead in, then erasing Obama’s advantage and taking the lead in Virginia (13 ev, 0.9% Obama lead), Florida (27 ev, 1.0% Obama lead), Iowa (6 ev, 1.2% Obama lead), Colorado (9 ev, 2.0% Obama lead), New Hampshire (4 ev, 2.2% Obama lead) and then Nevada (6 ev, 3.2% Obama lead).
Ohio may well return to the tipping point position tomorrow, but for now that is where we are.
The tipping point margin is a metric that looks pretty noisy over the past few weeks, so I would urge caution reading much into individual daily ups and downs. A lot of that is just going to be statistical noise. However, this represents the best margin in the tipping point state Obama has seen since October 7th in the midst of his downward plunge after the first debate. The upward trend in this measure of the state of the race is now looking more clear.
Tick tock. The time left for Romney to make a move in the polls is diminishing quickly. Will something gain traction? If not, then Romney’s main remaining hope is that all the polls, not just those from Democratic leaning pollsters, but all of them, are actually wrong and are systematically tilting toward Obama. This is not impossible, and along with the possibility of a last minute event that changes things, is likely a big part of why sites like 538 give Romney a 20%+ chance of winning. Views of this using just the raw polling data, like that done by Darryl at horsesass.org give a much lower chance of a Romney victory.
But then there is Sandy. Michael, A commenter on yesterday’s update, brought up the possibility of reduced voter turnout in areas of Pennsylvania affected by Hurricane Sandy making the state winnable for Romney. Unlike potential effects on popular opinion of Obama due to how he responds to the hurricane, turnout effects due to the storm may simply not be measurable by the polls. First of all, the degree to which any remaining issues from the storm may impact voting on Tuesday may not be clear until almost Tuesday. Second, because people in effected areas are busy dealing with the storm impact itself, they may be more reluctant to participate in polls, and some pollsters may not even bother trying.
Now, most people seem to think that the effects of the storm on actual voting next Tuesday will be minimal, as most services will have been restored by then, etc. But for argument’s sake, lets imagine that turnout in the Philadelphia area is significantly reduced, giving Pennsylvania to Romney despite Obama’s 4.6% lead in current polling. Let’s also give Virginia to Romney on the same basis… reduced turnout in Northern Virginia breaking what is essentially a tie in Virginia at the moment, and giving the state to Romney.
With those two states as well as the states he is already ahead in, we have Romney with 239 electoral votes. That is still 30 electoral votes short. If we start adding states in again based on how close Romney is… Florida… which is essentially tied right now… brings Romney to 268 electoral votes. Just one electoral vote short of a tie. Iowa would then be the tipping point state. With it’s 6 electoral votes, Romney would win 274 to 264. Romney is currently behind in Iowa by only 1.2% in my five poll average. (Only 2 of those 5 polls were concluded after the last presidential debate, and those last polls look better for Obama, but lets call it 1.2% for now.)
If Hurricane Sandy was indeed able to deliver Pennsylvania and Virginia for Romney, Obama would STILL be ahead… but it would be a LOT closer!
For the moment though, as long as that scenario does not develop, Obama’s position seems to be better now than it has been in weeks. He is increasing his lead in Ohio and other swing states. Even if you grant some movement toward Romney in Pennsylvania and Virginia that isn’t visible in the polls, it seems like Romney still needs something else to move things in his direction.
Before the hurricane, Romney’s camp seemed to be trying (but failing, at least in the critical states) to gain traction based on the Obama administration’s handling of the attacks in Benghazi on September 11th. Maybe a renewed push on that issue in the remaining days will do the trick? The Romney campaign has also been pushing hard in Ohio with an attack implying Obama’s policies are resulting in Jeep moving jobs from Ohio to China. Fact checkers have called these claims misleading at best, but that doesn’t necessarily stop the attack from being effective. Maybe that will start reversing the polling trend in Ohio? Or will there be some new event that moves things dramatically toward Romney?
Watch this space in the next few days. We’ll find out… :-)
(And of course, Romney’s apparent lead in national polls continues… so if the polling is correct and nothing changes before election day, the possibility of Romney winning the popular vote while losing the electoral college remains very strong.)
Note: I actually finished my daily sweep of the polls about 10-11 hours prior to making this blog post. I usually try to keep that gap shorter, but it is what it is. There have of course been new polls released in that time. Those will be included in tomorrow’s update.
Note: Chart and map from the Abulsme.com 2012 Electoral College Prediction page. Both assume Obama vs Romney with no strong third party candidate and show polling as it currently exists. Things will change before election day. On the map red is Romney, blue is Obama, gold states are too close to call. Lines on the chart represent how many more electoral votes a candidate would have than is needed to tie under several different scenarios. Up is good for Obama, Down is good for Romney.


Leave a Reply
You must be logged in to post a comment.