Four states change status today, three moving toward Romney, one moving toward Obama. On the surface this looks very good for Romney. We’ll look into why that might not be the case in a bit, but first lets look at the four states that move today:
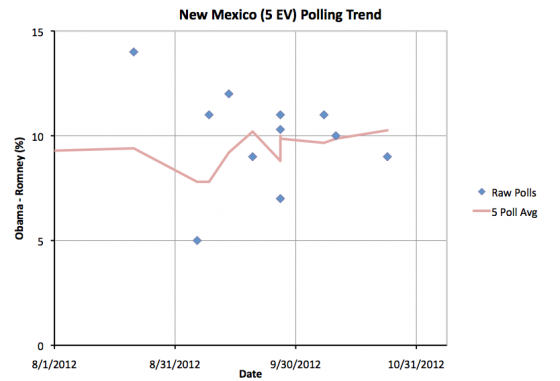
Very little to say about New Mexico. Obama’s lead increases slightly and is now over 10%. Obama will win New Mexico.
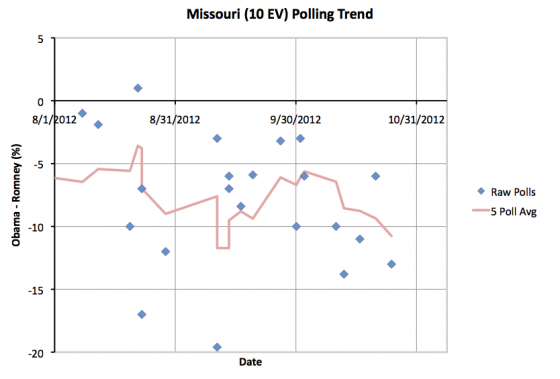
Not much to see in Missouri either. Romney’s lead increases slightly and is now over 10%. Romney will win Missouri.
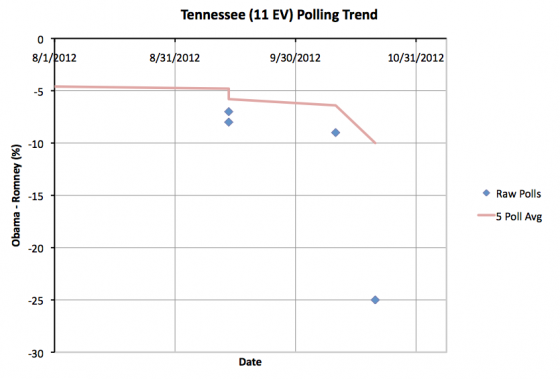
Tennessee is a bit odder. The new poll showing a 25% Romney lead in Tennessee looks like an outlier. No other poll in the state from the last year shows a Romney lead greater than 9%. Without this poll the five poll average has a Romney lead of 6.4%. With this, the Romney lead jumps to 10.0%, which moves Tennessee to the “Strong Romney” category. This may not be deserved, but I don’t make judgements about outliers, I just let the average sort it out. Either way, Tennessee’s not in contention this year. Romney will win Tennessee.
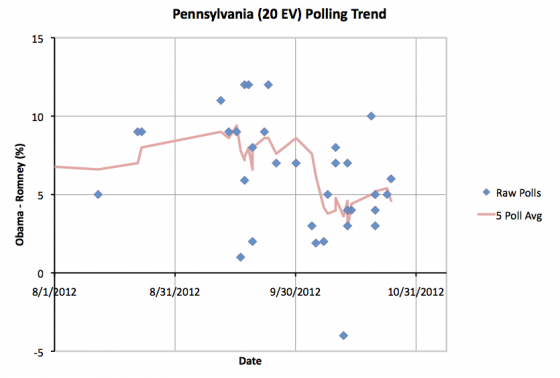
Pennsylvania shows Obama’s lead dropping under 5% again as an outlier showing Obama leading by 10% drops off. Again, we just let the average deal with outliers here, and that is what has happened. Pennsylvania returns to “Lean Obama” which probably better represents the true state of the race in Pennsylvania at the moment. Having said that, it is at the high end, Obama’s lead in the five poll average is now 4.6%. This is a pretty substantial lead. Any scenario that has Romney winning Pennsylvania would already have him wining the presidency handily.
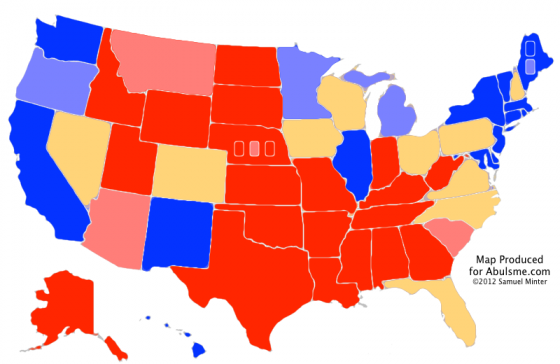
OK, so this gives us this new map and summary:
| Romney | Obama | |
|---|---|---|
| Romney Best Case | 321 | 217 |
| Current Status | 235 | 303 |
| Obama Best Case | 191 | 347 |
As before though, since depending which way the close states go you could have either candidate winning, we need to look at the individual states:
- North Carolina (15 ev): 2.4% Romney lead – 4/5 polls after last debate
- Florida (29 ev): 0.8% Romney lead – 5/5 polls after last debate
- Virginia (13 ev): TIE – 5/5 polls after last debate
- Iowa (6 ev): 1.2% Obama lead – 2/5 polls after last debate
- New Hampshire (4 ev): 2.2% Obama lead – 2/5 polls after last debate
- Colorado (9 ev): 2.8% Obama lead – 5/5 polls after last debate
- Nevada (6 ev): 2.8% Obama lead – 5/5 polls after last debate
- Ohio (18 ev): 3.1% Obama lead – 5/5 polls after last debate
- Wisconsin (10 ev): 3.8% Obama lead – 3/5 polls after last debate
- Pennsylvania (20 ev): 4.6% Obama lead – 2/5 polls after last debate
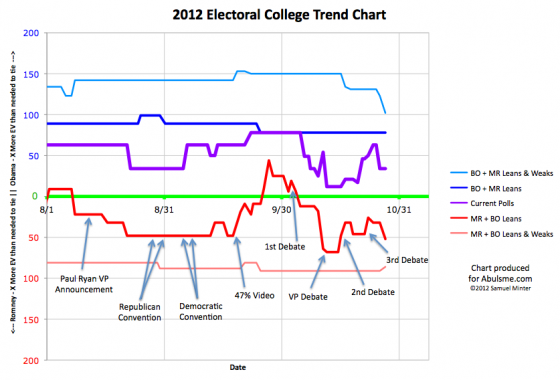
Something interesting here, but I am running out of time to go into detail. Ohio is no longer the tipping point state! If you start adding these states up in order of how far away they are from Romney, you see that Romney’s clearest path to victory is now holding North Carolina and Florida, then pulling ahead and winning Virginia, Iowa, New Hampshire, Colorado and Nevada. If he does that, he wins 273 to 265.
So as of today, if he moves every state more than 2.8% toward him, Romney wins. But yesterday that percentage was 2.5%. Wednesday it was 1.6%. Tuesday it was 1.2%
I may make a spiffy graph of this with the next update, but for now just looking at those numbers, you can see that despite moving some states closer to him, Romney’s path to victory is slipping away. The states he needs to pull ahead in are instead slowly pulling away.
Note: Chart and map from the Abulsme.com 2012 Electoral College Prediction page. Both assume Obama vs Romney with no strong third party candidate and show polling as it currently exists. Things will change before election day. On the map red is Romney, blue is Obama, gold states are too close to call. Lines on the chart represent how many more electoral votes a candidate would have than is needed to tie under several different scenarios. Up is good for Obama, Down is good for Romney.
Nate Silver says 75% chance Obama wins.
Silver is at 74.4% at this moment. Sam Wang at Princeton (who I like better than Silver at the moment) puts it between 87% and 96% depending on methodology. Darryl at HorsesAss, who I’ve exchanged notes with a number of times this year and who I also like, puts it at 93.4% at the moment. My method does not give percentage odds, but shows results fully consistent with all of those. Right now there is some movement toward Romney… but in states that won’t make a difference. In the states that he needs to get to 270, Obama’s lead is increasing and Romney’s paths to victory are slipping away. (As I mentioned at the end of my post.) I wanted to include a graph specifically showing this today, but I ran out of time. I’m going to see if I can get that done to include in my next update.
If I had to give odds based on my own analysis though, it would be closer to 80% to 90% for an Obama win than Silver’s 74%. As I mentioned in my post yesterday, if the status quo continues from now until election day, this is a clear Obama win. Romney’s hopes at this chance hinge on some big thing happening in the next week that shakes things up at the last minute. And those chances slip away by the day.
What are the odds of a electoral tie? Bring on the Romney – Biden administration!!
I definitely don’t predict the tie odds, but at the moment combinations that get you to 269-269 seem pretty implausible. Nate Silver puts tie odds at 1 in 250 right now. Darryl at HorsesAss put them at 1 in 205. So pretty far out there.
More interesting right now is the possibility of Obama winning the electoral college but losing the popular vote. Sam Wang recently estimated a 25% chance of that, although Nate Silver only put that at 5.3%. But the chances of that seem to be increasing daily. The movement on my chart recently shows moves toward Romney, but in states that don’t matter to the electoral college. That is a recipe for an electoral college / popular vote split, but in the reverse direction from 2000.
Wow – so I guess the Dems will stand on principle and yield to Romney in that case – you know…do the right thing – right?
Ha! Yeah right. I expect a full 180 degree reversal of everybody’s position on the electoral college if that happens. It would be fun to watch.
I retweeted some thoughts from @gerrycanavan on Saturday though about the possibility of state legislatures changing their minds on how to allocate electoral votes. Republicans seem to be bolder about that sort of thing than Democrats. In the case of the national popular vote going for Romney, but the electoral college going for Romney, you conceivably could just have a couple states where Obama won but there is a Republican legislature and governor pass new laws saying that “for the good of the country” those states would change how they allocated electors so rather than reflecting the vote in the state, the choice would reflect the national popular vote. Then BOOM, Romney wins after all. Of course, that would be a pretty bold thing to do. But quite legal.
If you want to see the opposite of an electoral college win with popular loss, take look at the Brady/Quinn Illinois gubernatorial election. I think Quinn won Cook and St Louis. The rest went for Brady. Quinn is governor.
Sorry – it was 4 counties.
Folks forget that the states really have full discretion on how to choose their electors. And they can change that at any time… including after the election as long as it is before the electors meet in December. They could choose the electors by the results of the election (boring!)… they could choose them by coin flip… they could choose them by actually picking the electors explicitly… or whatever they feel like. My personal favorite, which I think would actually be an improvement on the existing system…. pick electors by lottery. Anybody who wants to be an elector, put your name in. The actual electors get picked at random. Then those 538 people vote their conscience when the Electoral College meets in December.
Let me add links to the most recent updates from the three other sites besides mine I mentioned:
Nate Silver at FiveThirtyEight: http://fivethirtyeight.blogs.nytimes.com/2012/10/27/oct-26-state-poll-averages-usually-call-election-right/
Sam Wang at Princeton Election Consortium: http://election.princeton.edu/2012/10/27/landfall/
Darryl Holman at HorsesAss: http://horsesass.org/?p=47363
I like all three of their analysis quite a bit. I of course like my own as well, otherwise I wouldn’t do it. :-) I think mine provides a slightly different way of viewing things that is also useful and interesting. But theirs do give percentage odds when it is close, which mine does not. Maybe in 2020! We’ll see. :-)
Oh, and Jay, impressive map in that 2010 Illinois Gubernatorial Election. :-) http://en.wikipedia.org/wiki/Illinois_gubernatorial_election,_2010
Yeah – that’s why I posted.
@abulsme very interesting analysis. Eagerly awaiting ”spiffy graph”.
.@BYUfan Great, now I have to actually find the time to produce the spiffy graph! :-)