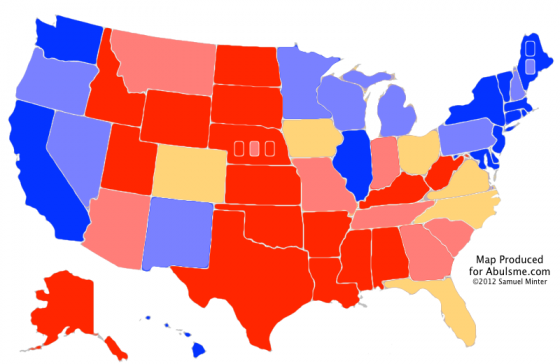
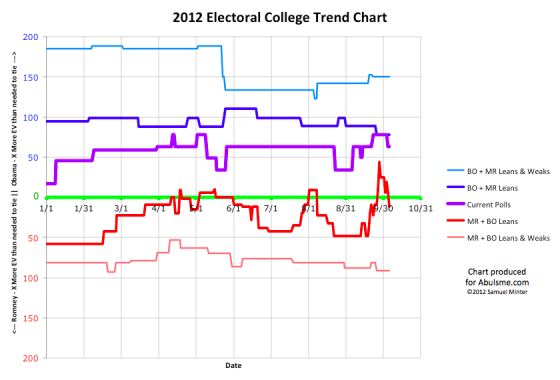
- EC for Fri Oct 5 done. Polls in 6 states. OH changes cats. Plus VA changed yest but I missed it. Blog post later today. http://t.co/kF2iz3uE #
- RT @ThoughtnDesign @abulsme Ur about the most independent guy I know. Did either candidate do enough to win u over. #
- .@ThoughtnDesign You know, I should read a transcript again for substance, I was watching mainly for style and presentation when watching. #
- .@ThoughtnDesign But no, I don’t think so. I don’t think any of my “most important Presidential issues” were really discussed. #
- .@ThoughtnDesign Most Domestic stuff is really congress. Most Economic stuff is really the Fed. #
- .@ThoughtnDesign & issues that I care about, like Intellectual Property, that they are both on the wrong side of, don’t even get mentioned. #
- RT @ThoughtnDesign @abulsme I never thought I’d say this, but it’s a crime that they don’t let second tier candidates in to this forum. #
- .@ThoughtnDesign It really would be a whole different thing with the 3rd parties. Even if they have no chance, it would move the discussion. #
|
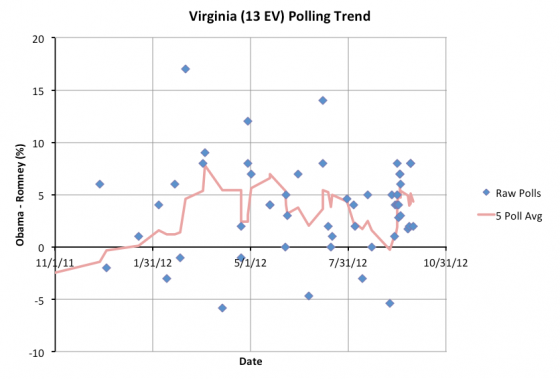
First, lets talk about Virginia. Virginia actually should have flipped back from “Weak Obama” to “Lean Obama” YESTERDAY. The data was in my spreadsheet. Virginia had clearly dropped below a 5% Obama lead again, to 4.3%. I have no idea how I missed it, but I did, and I did not mention it in yesterday’s update. I screwed up. I have corrected the historical trend graph above to reflect this category change as of yesterday. The graph below of the Virginia polls is as it was YESTERDAY, not yet including new data from today: As I mentioned when Virginia changed status on Wednesday, it is just bouncing back and forth. The recent history now looks like this:
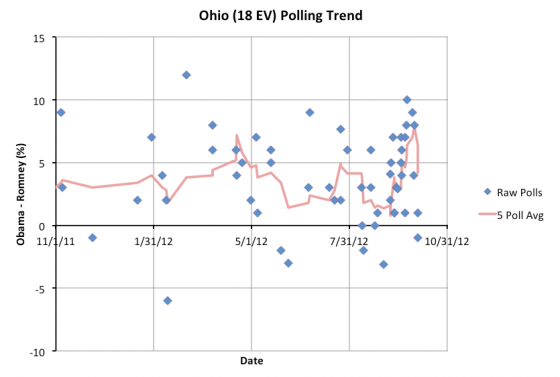
The latest change to move the state back to being a close state happened BEFORE any polls that were taken after the first debate. Now, I wouldn’t have known this yesterday, but today’s update contains two new Virginia polls, the first ones taken after the debate, and they suddenly show Romney ahead! So the five poll average is dropping rapidly, and is now down to a 2.8% Obama lead. So maybe this time we are done bouncing, and we’ll either stay close but leaning Obama, or end up moving to Leaning Romney. We’ll see. But as of the update that should have happened yesterday but I missed (damn it!) Virginia was still just bouncing back and forth, hovering around the “Obama 5% Lead” mark. Next up is a state that really does change due to today’s new data: Ohio had been moving rapidly in Obama’s direction. Every new day of polls seemed to increase Obama’s lead. Obama’s lead had gone over 5% on September 26th and had gotten up to a 7.8% lead in the 5 poll average as of yesterday. Today I added two new polls, both taken entirely on the 4th, which is of course after the first debate. One shows Obama up by only 1%, the other shows Romney up by 1%. Together they average to a tie. If more polls end up backing up these two new polls, it will show a very substantial movement due to the debate, on the order of a 7% or 8% shift. That would be gigantic. For now though, with three polls before the debate and two after, Obama’s lead in the five poll average is down to 4.2%. That puts the state back into the “Lean Obama” category, and puts it back into play for Romney. To summarize the updated state of the race:
The big change of course is that Romney’s best case once again includes winning. If he sweeps all the close states, now once again including Ohio and Virginia, he can win 281 to 257. Now, of the six close states, he is only ahead in North Carolina according to my five poll average, so this is still a tall order. But the new polls in Ohio indicate there just might have been a big debate effect. Other new polls with post debate data in Virginia, as mentioned above, and in Florida also show noticeable tightening, just nothing that changes a state to a new category yet. Both Virginia (if I’d properly updated it yesterday) and Florida were already categorized as close states. The new polls, so far, have made these states even closer, but have not actually flipped them over to be leaning Romney. If more new polls over the next few days continue to show big improvements for Romney though, we could see some of the Lean Obama states start flipping over to being Lean Romney states, and we could see a few more Weak Obama states become close Lean Obama states. So far we just have Ohio making a category change that seems like a clear debate effect. But Ohio is a big state, and there has still been very light post-debate polling. We’ll know better what the real effect of the first debate was after a few more days. Then we’ll hit the VP debate, and other changes in the news cycle, which will make it hard to determine if any further changes are really due to the debate, or from other things that happen later. Bottom line though, coming off a very bad month most of September, since September 27th Romney has been bouncing back. Since then his numbers have been fairly consistently improving. For now I’ll stick by the prediction that the beginning of September was his post-primary high water mark in my models though. I think his levels at that point… namely a 317 to 221 best case if he were to win ALL of the close states (an unlikely outcome) and a 303 to 235 Obama win “current status” if everybody just takes the states they are ahead in… is likely to serve as a ceiling for Romney’s gains. I don’t think he’ll be able to break past that point. Unless of course Obama has a whole lot more bad performances like his debate this week up his sleeve for the coming weeks. If that happens, then who knows. :-) Note: Chart and map from the Abulsme.com 2012 Electoral College Prediction page. Both assume Obama vs Romney with no strong third party candidate and show polling as it currently exists. Things will change before election day. On the map red is Romney, blue is Obama, gold states are too close to call. Lines on the chart represent how many more electoral votes a candidate would have than is needed to tie under several different scenarios. Up is good for Obama, Down is good for Romney. |
||||||||||||||


