Big day, lots of changes in polls behind the scenes aided by the fact I’ve now added PollTracker as a source. They seem to be picking up and including some polls left out by my other sources. The big batch of new polls today led to three category changes. So lets get to them in order of electoral college size from small to large:
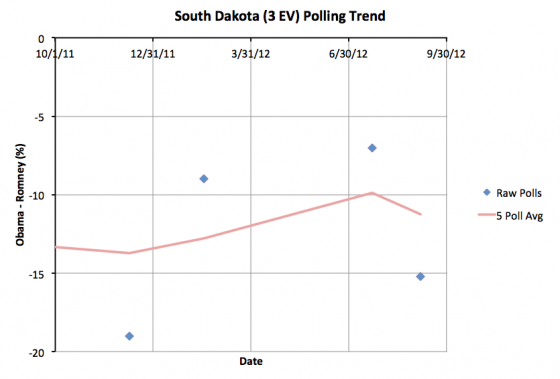
First up, South Dakota with 3 electoral votes. It has been very sparsely polled, but it is easy to see why. This state is not even remotely in contention. It is a Romney state. Back in August a new poll had brought the five poll average down to a Romney lead of less than 10%, moving it to “Weak Romney” instead of “Strong Romney”. Now the first poll since then moves it back to “Strong Romney”. Either way, South Dakota is not a state we imagine Obama winning even in his best possible scenario.
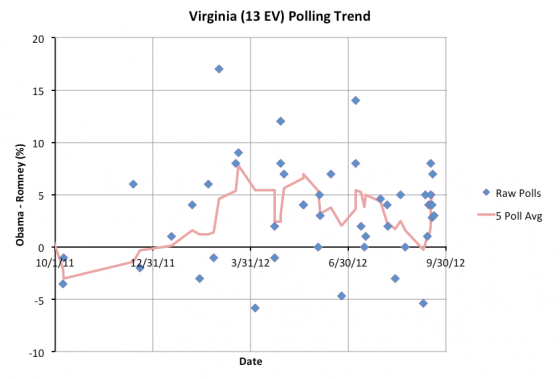
Next up is Virginia with 13 electoral votes. On Thursday Obama’s lead in the state tipped just barely over 5%. With a new poll today, it dips back just barely below 5%. So once again it goes into my “Lean Obama” category and it is once again considered one of the states Romney *could* win, even though he is currently behind in the state. So this improves Romney’s best case and opens up more possible “paths to victory” that one can mathematically imagine given the polling.
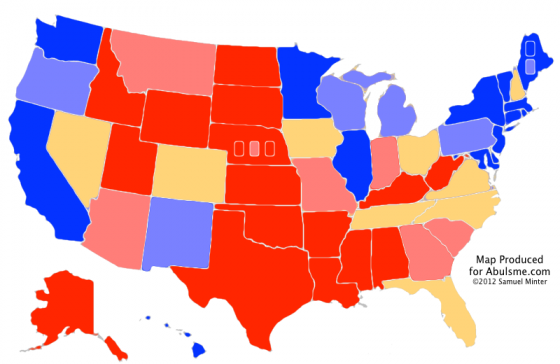
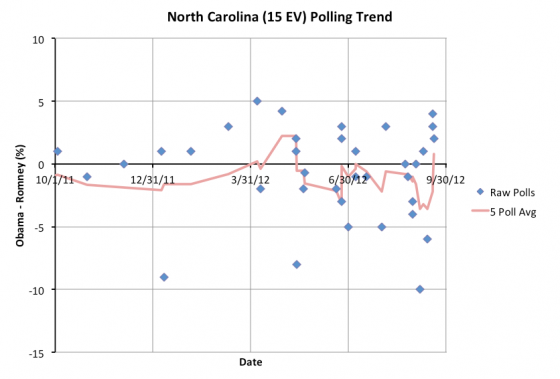
Finally, North Carolina with 15 electoral votes. Never once in the last year has this state not been “close”. Most of the time it has leaned toward Romney though, with just a few bounces toward Obama. Today’s batch of new polls are all favorable to Obama though, and the five poll average tips toward Obama, barely, at a 0.8% lead for Obama.
Now, there is some oddness in how I count polls here. When a poll includes results in more than one way (Likely Votes vs Registered, or with our without Leaners) rather than picking one version of the poll based on some criteria I make up, I count those as separate polls if they are reported differently by the sources I use. This will potentially overweight the one poll with multiple reports. I count on this effect being washed out over time. This state is close enough that it can make a difference though.
But the difference is between just barely leaning one way, and just barely leaning the other way. These two situations are barely distinguishable from each other. So, for instance, in the case of North Carolina, while the new polls tip the state over the center line, it should be kept front of mind that a 0.8% lead is NOTHING and is close enough that it can easily just be statistical or methodological noise, and even if it isn’t, is close enough it can be wiped out overnight by the events in a news cycle.
So while this does move the “everybody gets every state they are ahead in” line in my models, do keep in mind that ALL of the “close” states should be considered to be states that easily could go either way.
So, with all of these, the new model summary:
| Romney | Obama | |
|---|---|---|
| Romney Best Case | 291 | 247 |
| Current Status | 191 | 347 |
| Obama Best Case | 180 | 358 |
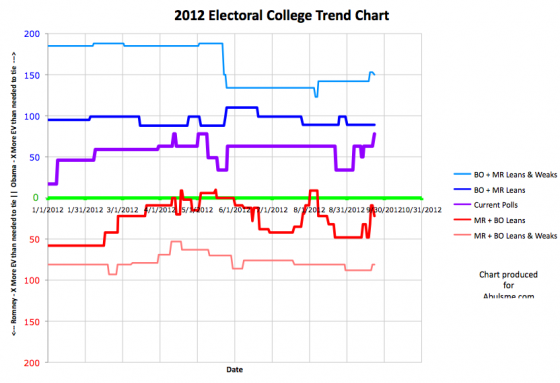
With this the “Current Status” where everybody gets every state they are ahead in is back up to matching Obama’s previous highs in April and May. Even with Obama’s best case, he isn’t matching his 2008 performance. But he is at what has so far been his ceiling in this race. To move beyond this he needs to start pulling ahead in states like Tennessee, Georgia, Arizona, Indiana, Missouri, South Carolina and Montana. All of these have so far seemed way out of reach this time around. And they still do. We would need a major Romney collapse to start bringing these states over to Obama.
As I said though, this lead in North Carolina is by the slimmest of margins, and is helped along slightly by my methodology. It would not be surprising at all for this to flip back to the “normal” 332 to 206 Obama victory margin we’ve been seeing most of the year in my model.
In the mean time, Virginia getting a bit closer again is good news for Romney. If he can’t bring states like Virginia back to being at least close, it is really hard to see how he pulls off a win. Having said that though, the recent trend in Virginia has been against him. We’ll need more polls (I’m sure we’ll have them soon) to know if Romney is really making Virginia close again, or if it will slip back away from him with the next batch of polls.
Note: Chart and map from the Abulsme.com 2012 Electoral College Prediction page. Both assume Obama vs Romney with no strong third party candidate and show polling as it currently exists. Things will change before election day. On the map red is Romney, blue is Obama, gold states are too close to call. Lines on the chart represent how many more electoral votes a candidate would have than is needed to tie under several different scenarios. Up is good for Obama, Down is good for Romney.
(Edited 2012 Sep 22 23:50 to add some final thoughts and do some cleanup.)
Leave a Reply
You must be logged in to post a comment.