Lots of polls in lots of states, but two changing status today, and they are both important moves… so lets get right to them:
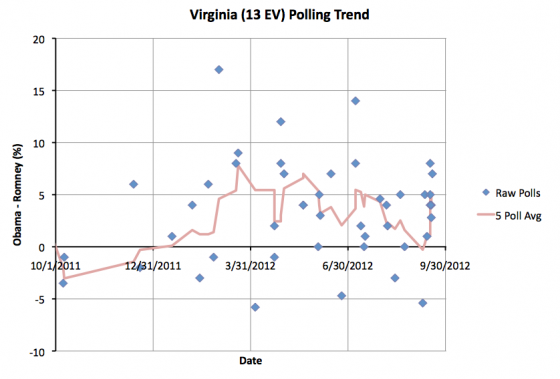
Polling in Virginia has gone into overdrive. In the last month there have been 11 polls added to my spreadsheet for Virginia. Eight of those have been just in the last week. The five poll average now only goes back four days. Things really are speeding up. On September 12th the five poll average in Virginia actually moved to an 0.3% Romney lead. On the 14th Obama took the lead again. Since then Obama’s lead has increased each day there have been new polls.
Today the five poll average goes above 5%. Obama is now ahead by 5.2%. This is just barely past my category boundary, so it would be easy for the next poll to reverse this move, but for the moment, Virginia gets colored blue as it moves from “Lean Obama” to “Weak Obama” in my models. This means that my “Best Case for Romney” model no longer includes the possibility of winning Virginia.
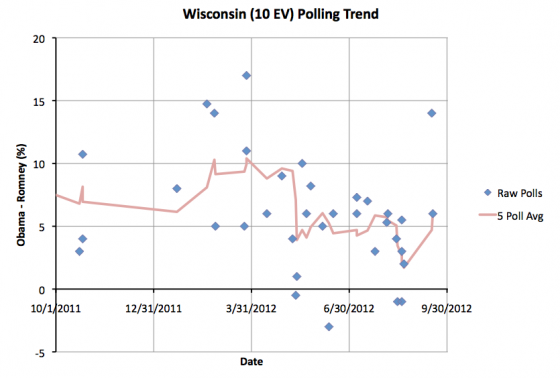
Polling has not been quite as prolific in Wisconsin. The five poll average goes back to August 23rd. At the end of August there were a bunch of polls trying to gauge reaction to the Paul Ryan pick for VP. And indeed, those polls showed Obama’s lead in the state dropping from 5.9% at the end of July, to a low of 1.7% at the end of August. There have only been two new polls since then, one showing a 6% Obama lead, and the other a 14% Obama lead.
The 14% poll seems like it would represent an extrodinary amount of movement, and it may well prove out in the end to be an outlier. We need more polls to validate the true post-Convention situation in Wisconsin. It seems clear there has been movement back toward Obama, but if the 14% poll proves to be an outlier, then the degree of that movement will be exaggerated.
For the moment though, the five poll average moves to an Obama lead of 6.1%. So like Virginia, Wisconsin moves out of Romney’s reach in my models. Even in the case where Romney sweeps all the “close” states, I don’t consider the winning in Wisconsin as part of the picture.
So, the new model summary:
| Romney | Obama | |
|---|---|---|
| Romney Best Case | 278 | 260 |
| Current Status | 206 | 332 |
| Obama Best Case | 180 | 358 |
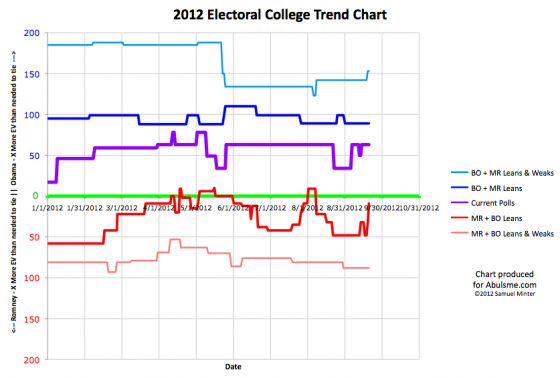
Now, the first thing I want to point out, as I often do, is that this represents “if the election was held today”… which of course it is not. The time left is vanishing quickly, but there is still plenty of time for big movement in the polls and the state of this summary. Things WILL change plenty before election day.
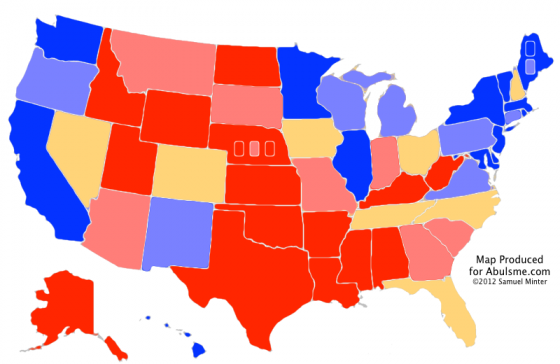
But as of right now… I had mentioned yesterday that we had a “hard map” for Romney. With Virginia and Wisconsin out of play, it becomes even harder. If Romney wins every single close state, he would win by a very slim margin. Only 9 more electoral votes than needed for a tie.
This means Florida (where Obama is ahead by 1.6%), Ohio (where Obama is ahead by 4.2%), North Carolina (where Romney is ahead by 3.6%), Tennessee (where Romney is ahead by 4.2%) and Colorado (where Obama is ahead by 1.4%) are now all must win states for Romney. If he loses any of those five states, he loses the election.
Tennessee looks pretty safe. Romney’s lead is less than 5%, but Obama has never been ahead in the five poll average.
North Carolina looks kinda safe too, but not quite as much. Obama has occasionally been ahead in the five poll average in North Carolina. It has usually been Romney though. A comeback for Obama might be possible there, but the recent trend has been toward Romney, not away from him.
In Colorado, Romney has never been ahead in the five poll average. He has been pretty close though, at one point only being behind by 0.2%. And at the moment that 1.4% is looking well within reach. The recent trend has been toward Romney.
Florida is looking iffier though. The lead in the five poll average has gone back and forth a bit, but for most of the last year, it has shown a very narrow Obama lead. It is a very close state. It could go either way. It is certainly not out of reach for Romney, he can win Florida. But he is behind there now, and has been most of the last year with just a few short spikes where he has been ahead.
Then there is Ohio. Although occasional individual polls have shown Romney ahead, at absolutely no time in the last year has Romney led in Ohio. Romney’s best performance in the five poll average was only being behind by 1.4%. His current 4.2% deficit in Ohio is not an impossible deficit. We call it a close state for a reason. A move that size CAN happen. But Romney has to really move things to get there.
Winning all five of these states will be quite a task. Not impossible by any means, but quite a task.
But remember, even if Romney sweeps these five “must win” states, it only gets him to 262 electoral votes. He would still need 7 more electoral votes to tie, or 8 more to win outright. That means he needs to win two out of three of the remaining close states… Iowa (where Romney is behind by 1%), Nevada (where Romney is behind by 3.8%), and New Hampshire (where Romney is behind by 2.4%).
Romney’s winning scenarios are possible. The paths are just very narrow at the moment.
Romney needs something big to shake up the race and start moving things in his direction. We’ll see what he comes up with. (Or what comes his way via luck or missteps by Obama.)
Note added 2012 Sep 25 12:09 UTC: Polls added to my data on September 25th moved the date Wisconsin moved from Lean Obama to Weak Obama from September 20th (the day of this post) to September 21st.
Note: Chart and map from the Abulsme.com 2012 Electoral College Prediction page. Both assume Obama vs Romney with no strong third party candidate and show polling as it currently exists. Things will change before election day. On the map red is Romney, blue is Obama, gold states are too close to call. Lines on the chart represent how many more electoral votes a candidate would have than is needed to tie under several different scenarios. Up is good for Obama, Down is good for Romney.


Leave a Reply
You must be logged in to post a comment.