- Reading – Is the вЂFull’ Secret Video of Romney at Fundraiser Really Unedited? (Benny Johnson) http://t.co/T9YoTkPj #
- Reading – Reality Check (Andrew Sullivan) http://t.co/K9exEw2b #
- A few minutes ago I agreed that Amy could be the first one in the family with an iPhone 5. Her iPhone 4 died a couple days ago. So jealous! #
- Reading – Sept. 17: Electoral College May Not Help Obama (Nate Silver) http://t.co/VDJw2Wsg #
- Reading – 5 ways Mitt Romney can (still) turn the 2012 race around (Chris Cillizza) http://t.co/tmF97UBh #
- Reading – AT&T LTE goes live in Seattle ahead of iPhone 5 launch (Bryan Bishop) http://t.co/DIWighvY #
- Alex fed an entire can of fish food to Hush the fish. Emergency tank cleaning now in progress. #
- RT @GarrettQuinn: VENTURA: If I see light on the horizon with Gary Johnson you might see Jesse Ventura in 2016. #
- Reading – Who to Support This Election? (Bruce, The Contrarian Conformist) http://t.co/RjOwoZmN #
- Reading – Entitled to Food (Carl, HorsesAss) http://t.co/EqhKiIJE #
- Reading – Why Barack Obama is winning (Jonathan Martin) http://t.co/7LUkNZng #
- EC Update for Wed Sep 19 Done. Polls added for VA MI MA OR PA FL CO NH IN. Category changes in MI & IN. Blog post soon. http://t.co/kF2iz3uE #
- Reading – Thoughts on Twitter for iPad (Pavan Rajam) http://t.co/1NwCVETG #
- Lunch tweets! #
- Pet peeve: HDTVs in public places showing SD content in “stretch” mode. Really? Spring for the HD package! It looks idiotic. #
- MT @jbplainblog: RT @stevekornacki: I don’t get the point of polling swing states together. Just stick with national or individual states #
- MT @JeffreyGoldberg: When I saw @DavidCornDC the other night, he neglected to mention that he was about to destroy the Romney campaign. #
- Reading – Time for an Intervention (Peggy Noonan) http://t.co/hbselmuA #
- Reading – Ars Technica: вЂMotorola Asks ITC to Ban Every Mac, iPad, and Most iPhones…’ (John Gruber) http://t.co/VV72uygN #
- Reading – Roundup of iOS 6 Launch Day News and Reviews
(Eric Slivka) http://t.co/0jAGkpv7 # - BTW, dreading iOS 6 cause Alex’s fav thing on iPhone is YouTube app that is going away. New one is much harder to use. He has rejected it. #
- RT @GarrettQuinn: LP strategist to me on Johnson getting 5% nationwide? “I would be happy to get 5% in a couple of states.” #
- Reading – A Mood of Gloom Afflicts the Romney Campaign (Michael Barbaro) http://t.co/lKi7bxNq #
- And now back to work… #
- .@joshtpm @polltracker Can I tell the app I want notifications on ALL state prez polls, or do I have to favorite 50 states + DC separately? #
- RT @joshtpm @abulsme @PollTracker u have to do it individually. we dont want people to get overwhelmed. but its easy to do #
- .@joshtpm Added the swing states for now. I’ll add more later perhaps. Note you don’t have DC. Not many polls there anyway. :-) #
|
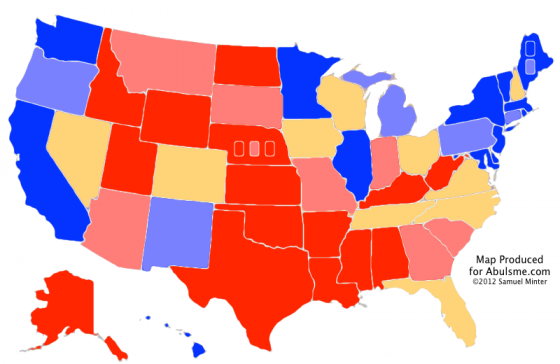
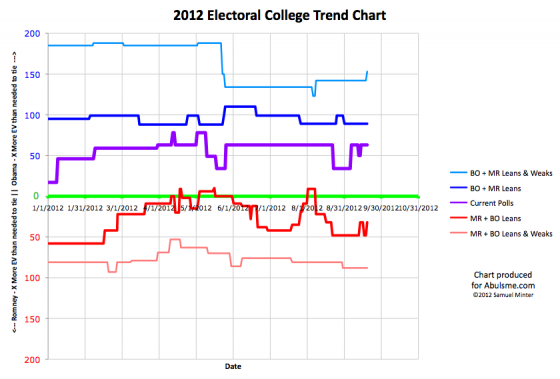
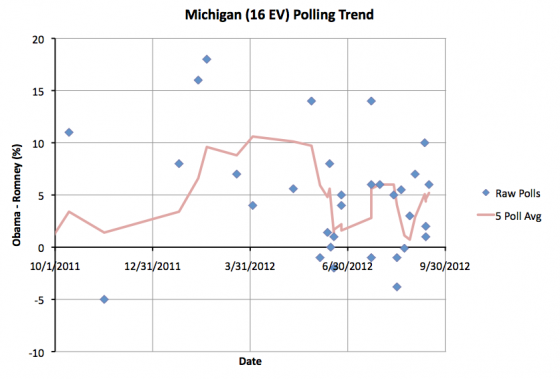
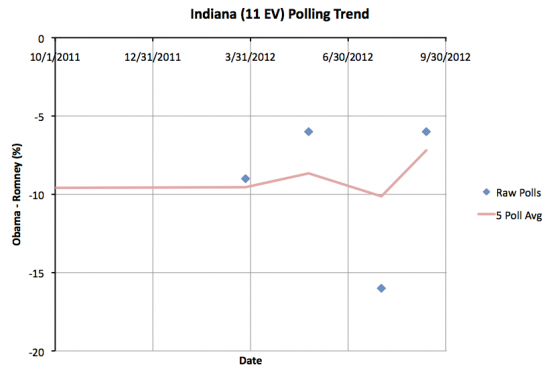
The rate of polling has increased dramatically since the convention ended. It is now not uncommon for my daily sweep for new polls to pick up six or more new polls. In the pre convention days, having three polls on a single day would be a big day. This increase in poll frequency of course makes it likely that we’ll have more days where states flip categories, even if it is just from the natural jittering of random samples rather than real movements. So be sure to watch not just for the states that change on a given day, but also look to see if that change “sticks” as time goes on and new polls come in. Today we have two states change status. In order by Electoral College weight: First up Michigan with 16 electoral votes. It has bounced back and forth across the 5% Obama lead line the past few weeks in the five poll average. September started with Obama having an 0.7% lead in the state. September 13th his lead increased to over 5%, but then dropped below 5% again on the 16th. Now on the 19th it heads above 5% again. The general trend has been toward Obama, but at 5.2% the state is still quite close to the boundary between my categories. So it would be easy for the very next poll to pull the average back below 5%. For the moment, the state moves from my “Lean Obama” category to my “Weak Obama” category, meaning that I no longer consider Romney winning Michigan a possibility strong enough to include in his “best case”. But don’t be surprised if it gets closer and changes categories again. It looks like it is having fun bouncing back and forth at the moment. Next up, Indiana with 11 electoral votes. Indiana has been very sparsely polled. Only four Romney/Obama polls in the state since the 2008 election. To round out the five poll average I have to include the 2008 McCain/Obama election results. In any case, prior to the last poll, the five poll average (which then included the 2004 election too) had the state with a 10.1% Romney lead. Shifting the new poll in, and 2004 out… 2004 was a huge 20.7% Bush victory over Kerry in Indiana… makes Romney’s lead drop to 7.2%. This moves Indiana out of my “Strong Romney” category into my “Weak Romney” category, but make no mistake, Romney’s lead in Indiana is still quite substantial. At the moment nobody is expecting Obama to be able to reprise his 2008 win in the state. We’d need more polls than just the four to discern if there is actually any sort of trend making the state closer, but a little bit closer or not, it still isn’t close enough to be one of the states that could go either way. This is a Romney state this year unless we get a huge Romney collapse in the next seven weeks. So only Michigan changes anything in the models, making Romney’s best case slightly weaker, but still a win:
Once again no mathematically “must win” states for Romney, but the paths are still narrow… this is a hard map for Romney. If he doesn’t win Florida, he has to win every other close state to win. If he does win Florida, he can afford a few losses in the close states, but not many. But if he loses Florida, it is hard seeing how he wins the other close states he would need to win. Romney still needs a game changer to move things in his direction. And I’m pretty sure the events of the last few news cycles are not the kinds of game changers he needs. Note: Chart and map from the Abulsme.com 2012 Electoral College Prediction page. Both assume Obama vs Romney with no strong third party candidate and show polling as it currently exists. Things will change before election day. On the map red is Romney, blue is Obama, gold states are too close to call. Lines on the chart represent how many more electoral votes a candidate would have than is needed to tie under several different scenarios. Up is good for Obama, Down is good for Romney. |
||||||||||||||


