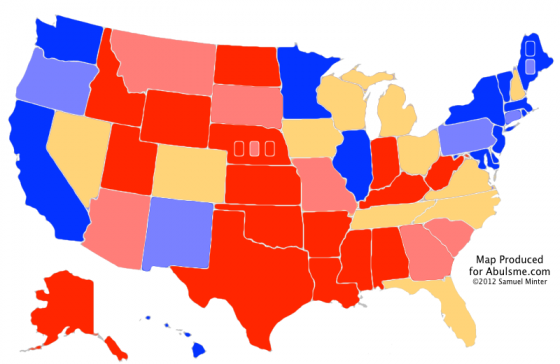
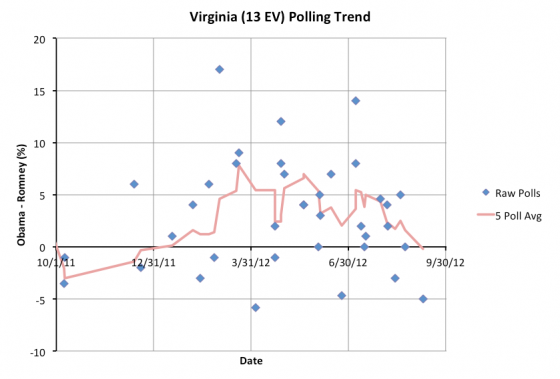
One state changes status today and it moves in a surprising direction given the overwhelming talk of the Obama bounce following the Democratic Convention. Virginia moves from just barely Obama, to just barely Romney:
Since the Conventions ended, I’ve added polls in AL, AZ, FL, IL, MA, MN, NC, NJ, NM, OH, VA and WA. Twelve states. Eleven of these states didn’t change categories. Now the first one does, and it is Virginia. Not moving toward Obama, but moving toward Romney. But what about the bounce?? Aren’t all the polls showing a massive movement toward Obama right now? What is going on?
Well, the national polls have been showing that kind of move. The expectation is that the state polls will naturally follow. If the “bounce” lasts awhile and does not immediately fade, then they probably still will. But so far that just isn’t showing up. Now, since I use a five poll average, even if there is a move on one new poll, it might not cause a category shift right away. In most of these cases though, the new polls at the state level have been right in the same general range as the polls from before the conventions. Perhaps there has been some movement, just none that has moved any state to a new category in my model.
Until Virginia. Moving toward Romney. The five poll average moves from an Obama lead of 1.6% to a Romney lead of 0.2%. As usual when states move from “leaning” one way to “leaning” I will point out that any lead under 5% can disappear overnight with the right set of things in the news. I color all the states where the lead is less than 5% the same color on my map. These states really are close. They could go either way. And the states where the margin is less than 2%? Even more so. You might as well flip a coin.
So one should be very careful ascribing too much significance when one state flips back and forth across the line. The “current” model does move in this case… where every state goes the way the five poll average stands today. But I list the two “best case” scenarios here for a reason. To see where we really are, you need to look at that full range of possibilities. (Although of course we’re more likely to get a result “toward the middle” than near the edges of this range where one or the other candidate sweep all the close states… itself an unlikely scenario.)
In any case, the new update to the models:
| Romney | Obama | |
|---|---|---|
| Romney Best Case | 317 | 221 |
| Current Status | 219 | 319 |
| Obama Best Case | 180 | 358 |
Bottom line, Obama is still ahead. He has a much stronger position. But Romney does have multiple ways to win. If the conventions have produced a bounce that improves Obama’s position substantially, it isn’t showing up in the electoral college yet.
My prediction from my last update that the beginning of September was going to be Romney’s peak in my model looks like it hasn’t come to pass though. My model shows Romney in a bit better position now than he was at the time of that update. Oh well! (Edit 2012 Sep 13 16:25… actually, my prediction was that the beginning of September would mark Romney’s peak. Although Virginia flipping did improve Romney’s position over the last update, it still isn’t as good as it was at the beginning of September, so my prediction has actually held so far…)
Conventional wisdom is that you have to wait for a couple weeks after the convention for public opinion to “settle down”. Add to that the fact that if you are looking state by state you have to wait for the critical states to get polled and you realize we’ve still got very incomplete information at the state level.
Since the conventions ended, of the close states Florida (29), Ohio (18), North Carolina (15) and Virginia (13) have been polled. Of these, only Ohio has been polled more than once. No new polls at all yet for Michigan (16), Tennessee (11), Wisconsin (10), Colorado(9), Iowa (6), Nevada (6), or New Hampshire (4).
So… we still need to wait for a bit more polling to see where things really stand in this post convention stage. Polling should be continuing to accelerate as we approach November, so with luck we won’t have to wait too long.
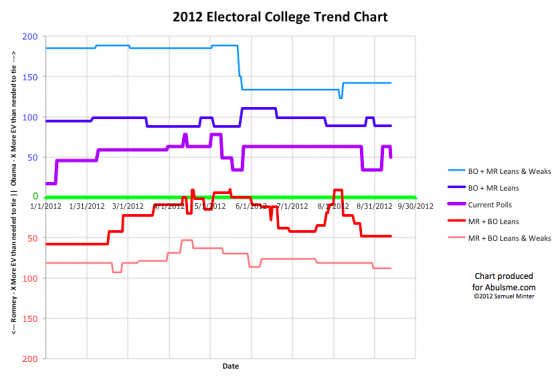
Note: Chart and map from the Abulsme.com 2012 Electoral College Prediction page. Both assume Obama vs Romney with no strong third party candidate and show polling as it currently exists. Things will change before election day. On the map red is Romney, blue is Obama, gold states are too close to call. Lines on the chart represent how many more electoral votes a candidate would have than is needed to tie under several different scenarios. Up is good for Obama, Down is good for Romney.
Edit 2012 Sep 12 11:13 UTC to correct the list of states with polls added since the convention to include AL and NJ, which I’d forgotten.


FYI, the maps are exactly the same for the last three updates.
Indeed. As they should be. The last two updates moved Florida from Lean Romney to Lean Obama, and Virginia from Lean Obama to Lean Romney. I color both of these categories gold rather than differentiating them in color, since really all these states are really just too close to call. Since these states remained in the “close state” category despite moving over the center line, the map didn’t change in the last two updates.
The chart showing the various models of course does change, since I show the purple line covering the “everybody gets every state they are even slightly ahead in” model.
You can do electoral map calculation at http://votenight.com