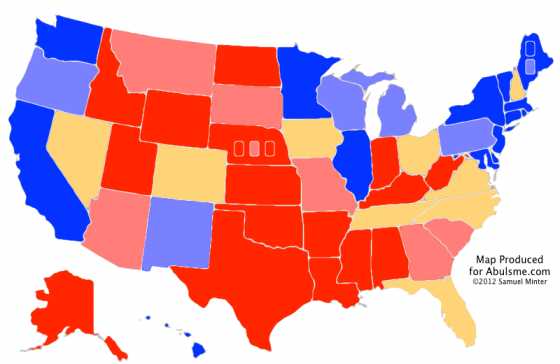
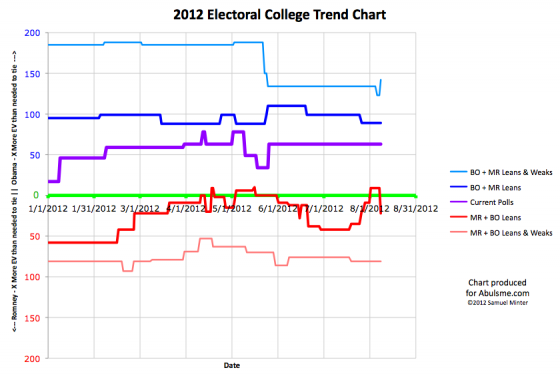
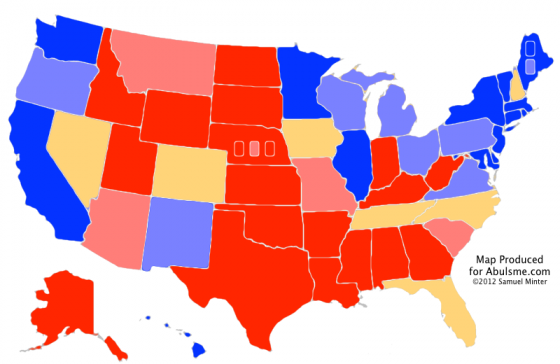
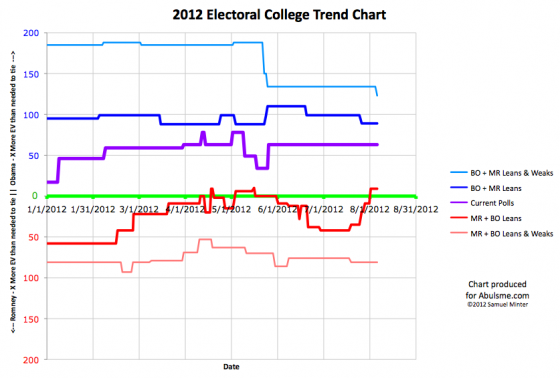
Chart and map from the Abulsme.com 2012 Electoral College Prediction page. Both assume Obama vs Romney with no strong third party candidate and show polling as it currently exists. Things will change before election day. On the map red is Romney, blue is Obama, gold states are too close to call. Lines on the chart represent how many more electoral votes a candidate would have than is needed to tie under several different scenarios. Up is good for Obama, Down is good for Romney.
Four states change categories today. In all four cases, the races look a little closer than they did. The impact is different in these cases, so lets look at each one. In order from the smallest number of electoral votes to the greatest…
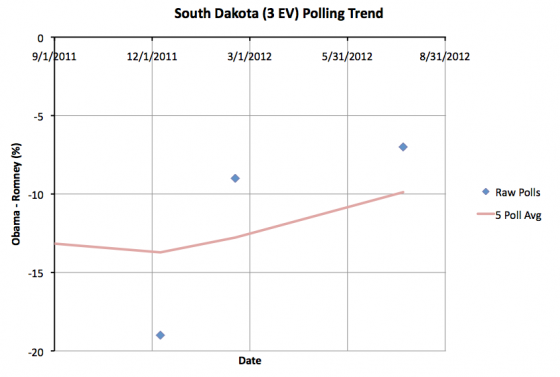
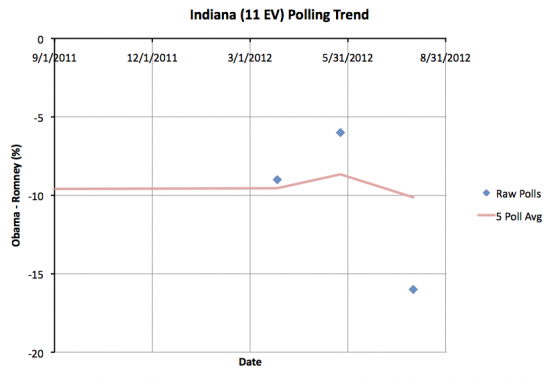
South Dakota (3 ev): South Dakota has been very sparsely polled. The poll added today is only the 3rd one in the last year and only the 4th since the 2008 election. With this update the 5 poll average (which includes the 2008 election to fill out the average) drops to a Romney lead of 9.9%. This is less than the 10% threshold I use, so I move the state from “Strong Romney” to “Weak Romney”. But obviously South Dakota is nowhere close to being a competitive state. It would take a move of epic proportions to actually make South Dakota a competitive state. But the three polls this year do seem to show that Romney’s lead is a bit less than it once was.
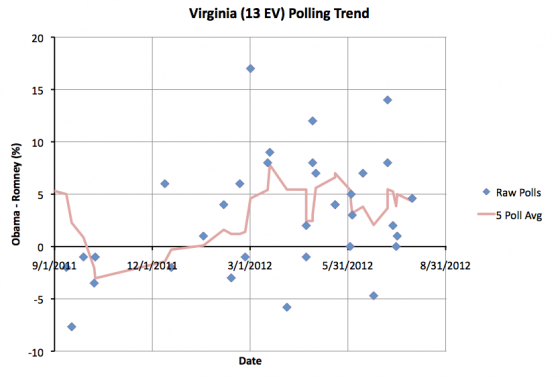
Virginia (13 ev): Obama’s lead in the five poll average had touched 5%, moving it out of the close state category, but it didn’t last. The latest poll added to the average brings Obama’s lead back down to 4.3%. This means Virginia is once again one of the states I consider close enough that it could easily go either way depending on the events of the campaign. This will improve Romney’s “Best Case” in my models. Virginia has been close for most of the last year so it is not surprising to see it here again.
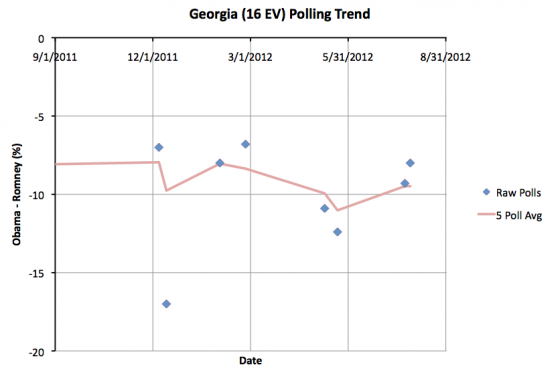
Georgia (16 ev): With two new polls added today, Romney’s lead in Georgia drops to 9.5%. Since this is below 10%, we move the state to “Weak Romney”. As with South Dakota, this is still a pretty substantial lead, and absent a major Romney collapse, it is unlikely to see Georgia actually become a competitive close state. But it is once again in the category where perhaps Romney shouldn’t take it completely for granted. Well, OK, he mostly can. But his margins do look a little bit less than they did before.
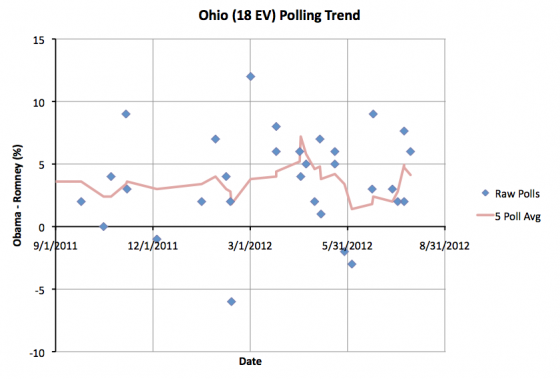
Ohio (18 ev): Along with Virginia, this is the other one that “matters” to the model. In my August 1st update the 5 poll average in Ohio jumped to 5.5%, moving it out of my swing state category. In today’s update we add a new poll… actually one that ended back on July 24th, prior to the last poll included in my last update, but which I just found (via Darryl at HorsesAss) so it counts for today*… and that new poll pulls Obama’s lead back down to 4.1%. So after the brief interlude as a blue state, Ohio is once again where it has been most of the year… with an Obama advantage, but not a huge one. So it is easy to imagine scenarios where Romney pulls it back over onto his side of the fence.
When you add up the changes in these four states, what do you get?
Well, South Dakota and Georgia really don’t change anything. For those two states, it isn’t about who will win, it is just about how much Romney will win by… which really doesn’t matter.
Virginia and Ohio on the other hand… they matter, and they are pretty big states. With both of these states on the table again, Romney’s best case improves considerably:
| Romney | Obama | |
|---|---|---|
| Romney Best Case | 291 | 247 |
| Current Status | 206 | 332 |
| Obama Best Case | 180 | 358 |
With this new configuration, Florida (29 ev) is a must win state. Romney can’t win without it. He could lose any one of Ohio (18 ev), North Carolina (15 ev), Virginia (13 ev) or Tennessee (11 ev), but only one of them. Colorado (9 ev), Iowa (6 ev), Nevada (6 ev) and New Hampshire are more flexible. There are a number of different “paths to victory” here now.
Now, most of these states (all but North Carolina and Tennessee) are ones where Obama has the lead at the moment, even if it is a small lead. To actually win, Romney has to actually start pulling ahead in some of these states rather than just reducing Obama’s lead.
That may be next. With a VP announcement “any time now” and the Republican Convention just around the corner, movement toward Romney should probably be expected. The questions will be: “How much movement?” and “Does it last?”.
(Spoilers: Convention bounces usually last about a week before things revert to where they were before, and VP choices only rarely end up making a difference.)
* If there is anybody who cares about the details and wonders why I didn’t do a retroactive adjustment of the historical graphs because I included an older poll that changed things, here is a long geeky explanation of my process: Basically, if you judge by the “end date” of the polls, polls come in out of order all the time. It takes pollsters a few days to compile and release their data, then sometimes it take a bit before it shows up on one of the three sources I use to collect poll data. If a new poll is within the “Last 5”, then I just treat it as current new data, regardless of the end date on the poll and if it is really the most recent to end. In this case, the poll wasn’t the newest, but it was the second newest. The last two polls had just gotten to me in reverse order, which happens pretty frequently. It is a little unusual that by the time I included it, the poll end date was about two weeks old, but it was still the second most recent poll. So it just got folded into the average normally. If I become aware of polls that are older than the Last 5, and those polls would have changed the category of any states, then I’ll fold a correction into my next update. Also while I’m giving esoteric details… The historical electoral college trend lines are based on the date new polls are included in my model (except when polls older than the most recent 5 are added), while the state polling trend chart uses the end date of the polls, which means they don’t always match exactly. So, for instance, the peak over 5% in Ohio has indeed disappeared with this new poll, instead now only peaking at 4.9%. The end dates of the polls are also used to determine just which polls are in the “Last 5” to begin with. In the case of multiple polls with the same end date, the tie breaker is the time they were added to my model.
Edit: 2012 Aug 8 08:15 to add that last parenthetical.
Edit: 2012 Aug 8 16:31 to add * note.
Edit: 2012 Aug 8 17:50 to correct one detail on the * note.
