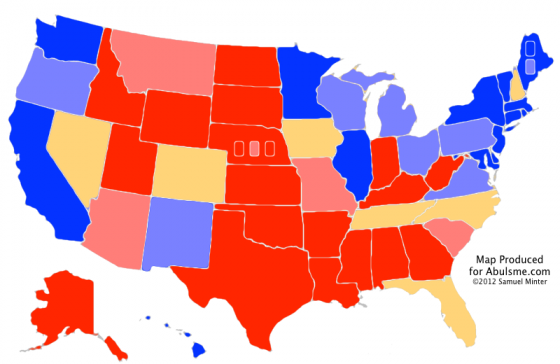
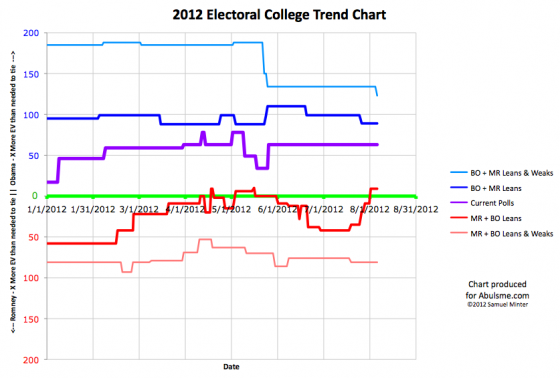
Chart and map from the Abulsme.com 2012 Electoral College Prediction page. Both assume Obama vs Romney with no strong third party candidate and show polling as it currently exists. Things will change before election day. On the map red is Romney, blue is Obama, gold states are too close to call. Lines on the chart represent how many more electoral votes a candidate would have than is needed to tie under several different scenarios. Up is good for Obama, Down is good for Romney.
One change today, in a very sparsely polled state…
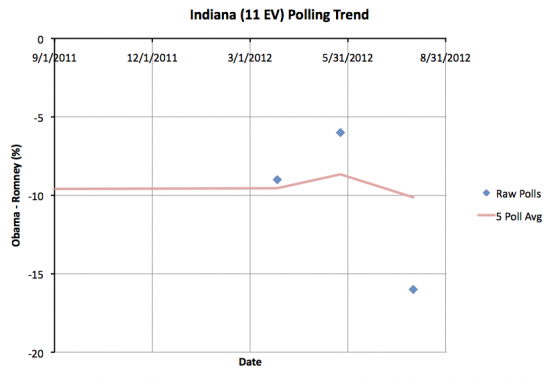
As far as I have found, there have only been THREE polls of Obama vs Romney in Indiana since the 2008 elections. To get my five poll average I actually include the 2004 and 2008 election results as proxies for real polls of the current candidates, just to “kick start” the state. Prior to today, the average was at an 8.7% Romney lead. That put Indiana in my “Weak Romney” category, meaning that Romney had a pretty good lead in the state, but not so much of a lead that he could take it completely for granted. With the right combination of events in the campaign, Obama could conceivably make it closer again… although winning might be a stretch.
Well, the newest poll shows a much more substantial Romney lead in the state, bringing the five poll average to a 10.1% Romney lead, enough for me to move it to the “Strong Romney” category. This means that Romney has a big enough lead here at the moment that he probably doesn’t even need to bother doing any defense in this state, and Obama would be wasting his time if he tried to contest it.
Now, since Indiana wasn’t and isn’t even remotely one of the “close” states, this does not change any of my models… Romney continues to win Indiana in all three…
| Romney | Obama | |
|---|---|---|
| Romney Best Case | 260 | 278 |
| Current Status | 206 | 332 |
| Obama Best Case | 180 | 358 |
…and continues to lose the election in all three too.


Leave a Reply
You must be logged in to post a comment.