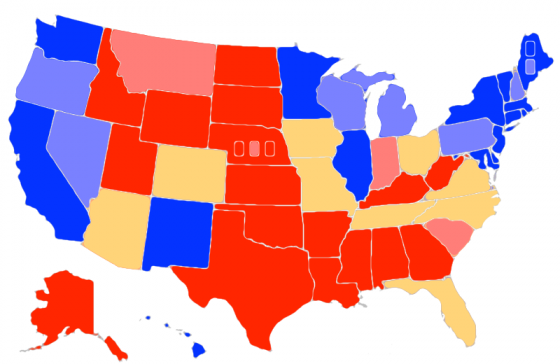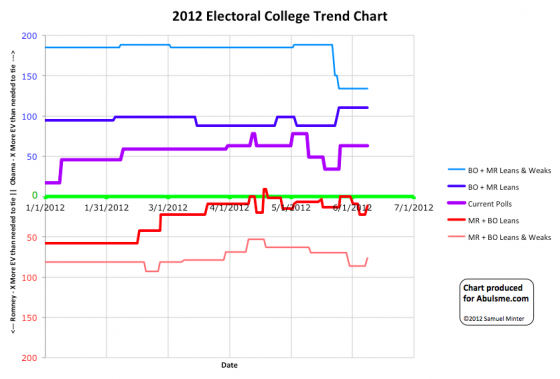

Chart and map from the Abulsme.com 2012 Electoral College Prediction page. Both assume Obama vs Romney with no strong third party candidate. Both show polling as it currently exists. Things will change before election day. On the map red is Romney, blue is Obama, gold states are too close to call. Lines on the chart represent how many more electoral votes a candidate would have than is needed to tie under several different scenarios. Up is good for Obama, Down is good for Romney.
Two states change status today, and they are both moves in Obama’s direction:

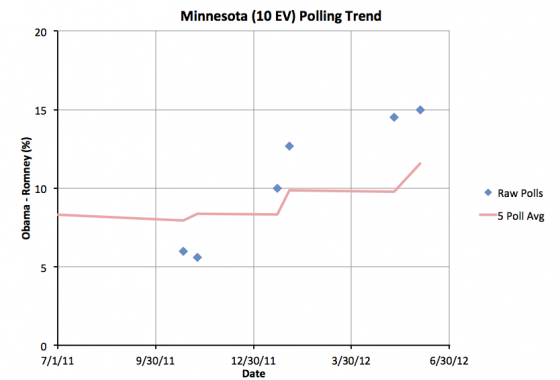
First up, Minnesota (10 ev) moves to “Strong Obama” as Obama’s lead in the state in the five poll average tops 10%. Minnesota has been pretty sparsely polled. Obama has always been significantly ahead in Minnesota, but some polls from last year had it close enough that maybe Obama would need to do a little defense in Minnesota. With the new polls, it is looking like Minnesota is safe enough that Obama can essentially ignore it. At least for now.

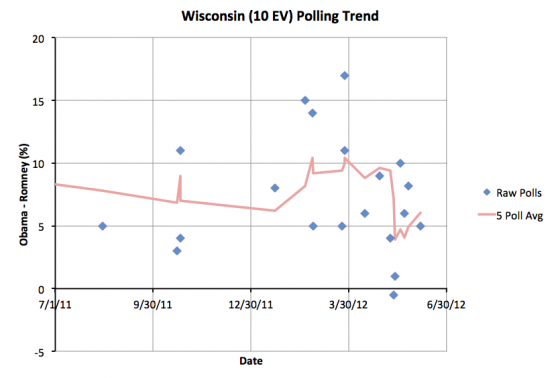
Second and more importantly, Obama’s lead in Wisconsin once again moves over 5%. From May 17th until today Obama’s lead had dropped below 5%, leading me to classify Wisconsin as only “Lean Obama” and therefore as a swing state. This weakening appears to have been short lived. Wisconsin is now back in the “Weak Obama” status, meaning that Obama has a significant lead, but not a big enough lead to feel safe about the state and ignore it.
Of these two changes, only Wisconsin effects the range of scenarios, reducing Romney’s margin in his best case, since that state is no longer on the table for him.
| Romney | Obama | |
|---|---|---|
| Romney Best Case | 281 | 257 |
| Current Status | 206 | 332 |
| Obama Best Case | 159 | 379 |
This now gives Romney a 12 electoral vote margin above the 269 he needs to tie. This makes Florida (29), Ohio (18), North Carolina (15) and Virginia (13) all into “must win” states for Romney. He can afford to lose any one of Arizona (11), Tennessee (11), Missouri (10), Colorado (9) or Iowa (6), but not two.
Finally, as I continue to go through the old data provided by Darryl at HorsesAss I find another old poll that requires a correction to my time series chart. This time it is an old Tennessee poll from October 2011. Frankly, it looks very much like an outlier compared to other Tennessee polls, showing Romney ahead by 18%, where his strongest showing in any other poll was a 7% lead, but it is a poll I would have included had I known about it, so there it is. The result of including this poll is to change the date when Tennessee moved from “Weak Romney” where it started the year to “Lean Romney” where it is now from March 2nd to May 24th. This is an almost three month move because Tennessee has been very sparsely polled. This only changes the historical status, not where Tennessee is today, which is a 4.2% Romney lead in the five poll average, making Tennessee a “swing state” in our model, but just barely.
The historical graphs have been corrected as of today’s post.
Leave a Reply
You must be logged in to post a comment.