- Reading – Pawlenty Aces North Carolina Audition (Zeke Miller) http://t.co/tRiqli6r #
- Reading – On Facebook, вЂLikes’ Become Ads (Somini Sengupta) http://t.co/JkhtgpOM #
- Reading – The Decorum, Skullduggery and Rivalries of the Presidents Club (PBS Newshour) http://t.co/tLi8zjPz #
- Reading – Romney could pick VP early, and cash in often (Steve Holland) http://t.co/ScsRIc60 #
- Reading – On Being Round (Neil deGrasse Tyson) http://t.co/qsiB8lsj #
- MT @ZekeJMiller: RT @whpresscorps: RT @ryanbeckwith Axelrod denies NYT report, says he was not at "Terror Tuesdays." http://t.co/oJJQno3i #
- Reading – Republican Party blocking massive Ron Paul event in Tampa? (Tom Mullen) http://t.co/IClUA81H #
- Reading – There Is Another Way (Atrios) http://t.co/0lgQXVni #
- Reading – U.S. drone targets in Yemen raise questions (Greg Miller) http://t.co/fzjo84R2 #
- Reading – Obama again bombs mourners (Glen Greenwald) http://t.co/Eyp7m6zU #
- RT @ZekeJMiller: Most important day of the campaign: November 2nd: Final jobs report before voters go to the polls. #
- Reading – Romney and McCain (Seth Masket) http://t.co/DX1hRMJh #
- RT @BrendanNyhan: Despite the hype, little difference between Romney and McCain's rate of delegate accumulation http://t.co/DX1hRMJh #
|
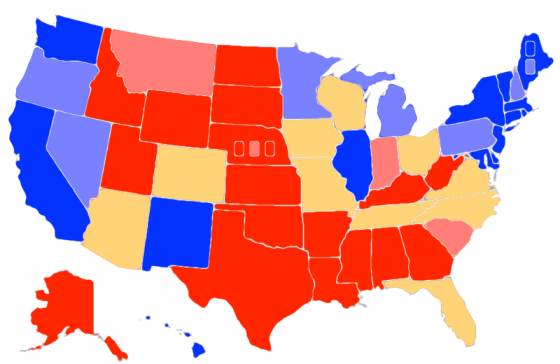
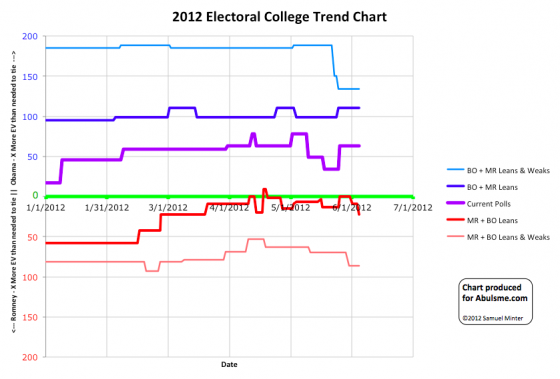
Chart and map from the Abulsme.com 2012 Electoral College Prediction page. Both assume Obama vs Romney with no strong third party candidate. Both show polling as it currently exists. Things will change before election day. On the map red is Romney, blue is Obama, gold states are too close to call. Lines on the chart represent how many more electoral votes a candidate would have than is needed to tie under several different scenarios. Up is good for Obama, Down is good for Romney. One state changes status today, and for the third time in a row, it is a change in Romney’s direction…
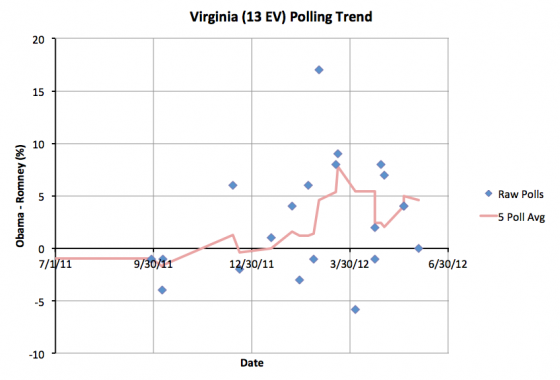
For a brief period starting May 26th, Obama’s lead was 5% in the five poll average in Virginia which put it in my “Weak Obama” category. No more. With today’s update it falls to 4.6%. So we once again move Virginia to “Lean Obama” which means it is a swing state in my model. This means Romney’s “best case” improves…
Romney’s best case now has him with 22 more electoral votes than he needs to tie. He is still significantly behind in terms of disposition of the swing states… there are many more ways for him to lose than there are to win… but he has many more different paths to win now. Florida (29) is now the only “must win” state that he just can’t win without. He can now afford to lose some of the others. Romney is doing what he needs to do, pulling “Weak Obama” states back down to where they are close and in contention. This is opening up the race a bit. If this trend continues, and if Romney is also able to start pulling some “Lean Obama” states to “Lean Romney”, and some “Lean Romney” to “Weak Romney” (taking them out of play for Obama) then this might start to become the close race that some commentators talk as if it already is. Edit 2012 Jun 5 17:18 UTC – Corrected wording which stated Obama’s five poll average was over 5%, when actually it was exactly 5%. |
||||||||||||||


