- Back in Seattle! Only 46 hours after originally scheduled! :-) #
- Reading – Missing вЂBig Bang’ Antarctic Telescope Found (Nancy Atkinson) http://t.co/7tLmzZEW #
- Reading – U.N. takeover of the Internet must be stopped, U.S. warned (Declan McCullagh) http://t.co/8YWSkZcn #
- Reading – “Militants”: media propaganda (Glenn Greenwald) http://t.co/YgcfupEc #
- RT @fivethirtyeight: Only 5 of the 682 Romney vs Obama polls we have in our database also included Gary Johnson as an option. #
|
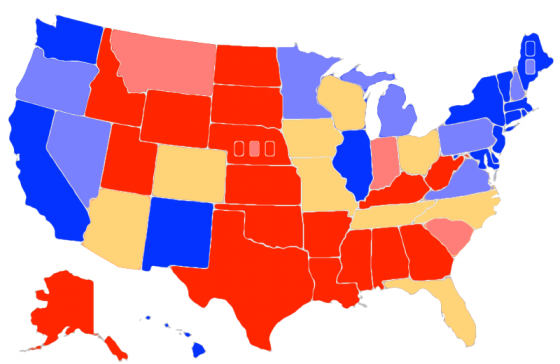
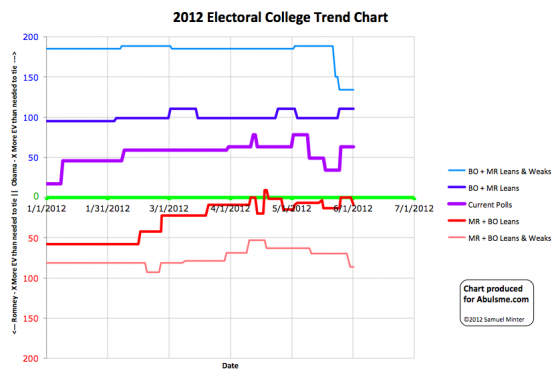
Chart and map from the Abulsme.com 2012 Electoral College Prediction page. Both assume Obama vs Romney with no strong third party candidate. Both show polling as it currently exists. Things will change before election day. On the map red is Romney, blue is Obama, gold states are too close to call. Lines on the chart represent how many more electoral votes a candidate would have than is needed to tie under several different scenarios. Up is good for Obama, Down is good for Romney. One state changes status today, and it is once again a move in Romney’s direction:
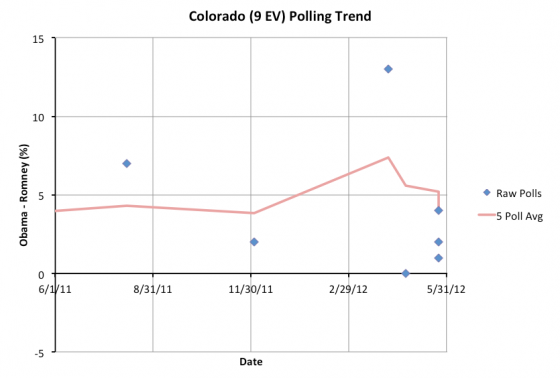
Colorado has been polled less frequently than one would expect. Since April 11th I have classified it as a “Weak Obama” state as the 5 poll average has been over 5%. It now looks clear that this was mostly on the strength of one PPP poll in April showing an Obama 13 point lead which now very much looks like an outlier. With the most recent polls, Obama’s lead falls back under 5%, so I move it back to “Lean Obama” again and it is now once again considered to be a state that could go either way. This improves Romney’s “best case”.
This move opens up some additional paths to victory for Romney. He can now afford to lose Iowa (6) if he wins the rest of the swing states. Or he can win Iowa (6) and lose Colorado (9) and still tie 269-269 and pull out a win in the House. But Florida (29), Ohio (18), North Carolina (15), Arizona (11), Tennessee (11), Missouri (10), and Wisconsin (10) are all still must win states. If Romney loses any one of them, he loses the election. And now, as I continue to go through data provided by Darryl at HorsesAss I have another correction to the old historical time series. In this case I was missing an old North Carolina poll from last September. This changed North Carolina’s status at the very beginning of the year from very slightly leaning Obama to very slightly leaning Romney. The old timeline had been:
Now it is simply:
This only changes what the status should have been at the very beginning of the year. Current status remains the same. The historical chart is corrected starting with today’s update. It is important to note that regardless of the flips back and forth from leaning one way to leaning the other way, North Carolina has been in the “swing state” status the whole time… it is just plain too close to call and has been the whole time. |
||||||||||||||


