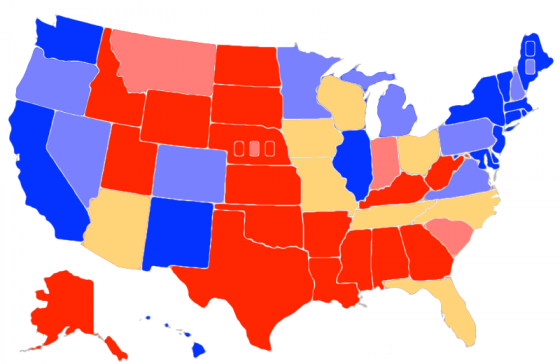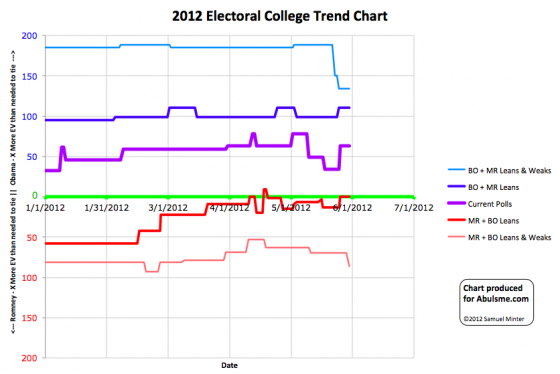

Chart and map from the Abulsme.com 2012 Electoral College Prediction page. Both assume Obama vs Romney with no strong third party candidate. Both show polling as it currently exists. Things will change before election day. On the map red is Romney, blue is Obama, gold states are too close to call. Lines on the chart represent how many more electoral votes a candidate would have than is needed to tie under several different scenarios. Up is good for Obama, Down is good for Romney.
One state changes status today, and it is a move toward Romney:

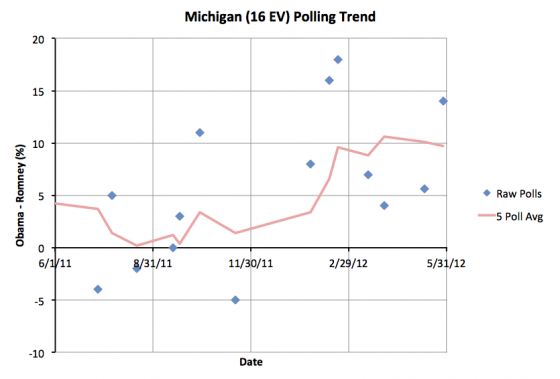
Michigan was in my “Strong Obama” category starting on April 10th. Today the five poll average drops to only a 9.7% lead for Obama, so the state drops to “Weak Obama”. As I’ve described this category many times before, this means that while Obama has a healthy lead, it is not so strong a lead that he can ignore the state. He has to play defense here, otherwise strong efforts from Romney (or big mistakes on his part) could make the state competitive again. As recently as February the five poll averages were such that Michigan was categorized as a swing state. It could go there again.
Since this does not change the inventory of swing states, the summary remains the same:
| Romney | Obama | |
|---|---|---|
| Romney Best Case | 269 | 269 |
| Current Status | 206 | 332 |
| Obama Best Case | 159 | 379 |
In addition to the change in Michigan today, I have a correction to the historical timeline for New Hampshire. Based on data provided by Darryl from HorsesAss I found a typo in one New Hampshire poll from March, and a few older polls from 2011 that I had missed when booting up these charts in January. The end result is that New Hampshire’s timeline changes slightly.
Prior to today I had this timeline:
- Jan 1 – Apr 19: Lean Romney (Swing State)
- Apr 19 – May 16: Lean Obama (Swing State)
- May 16 – Now: Weak Obama
With the corrections, the timeline should have been:
- Jan 1 – Feb 4: Weak Romney
- Feb 4 – Mar 31: Lean Romney (Swing State)
- Mar 31 – May 16: Lean Obama (Swing State)
- May 16 – Now: Weak Obama
These changes only effect the historical timeline, the current position remains the same. The chart showing the race over time has been updated with this correction starting with today’s update.
Leave a Reply
You must be logged in to post a comment.