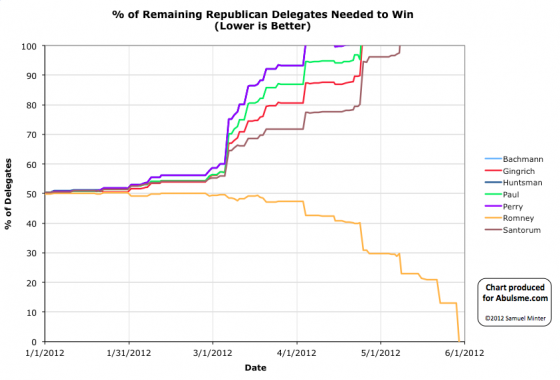
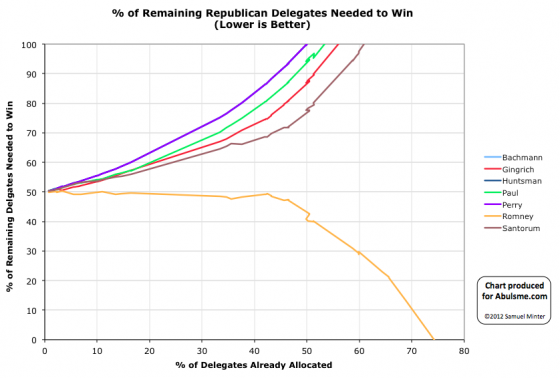
Charts from the Abulsme.com 2012 Republican Delegate Count Graphs page. When a candidate gets down to 0%, they have clinched the nomination. If they get above 100%, they have been mathematically eliminated. The first chart is by date, the second is by “% of Delegates Already Allocated”. These numbers include estimates of the eventual results of multi-stage caucus processes which will be refined as the later stages occur.
This is what we have been waiting for seemingly forever. By the beginning of March it was clear that no other candidate than Romney had the ability to get to 1144 absent a miracle. By the beginning of April it was clear that the non-Romney’s also were not going to be able to collectively block Romney absent a miracle. But Romney still needed to actually get to 1144. Slowly but surely he did so through April and May. Today he finally goes over the top. (At least with the count I use, which uses the Green Papers soft count plus the DCW Superdelegate Count. Other counts may differ.)
Since this is “the end” lets include a couple of additional graphs with two other views of the race:
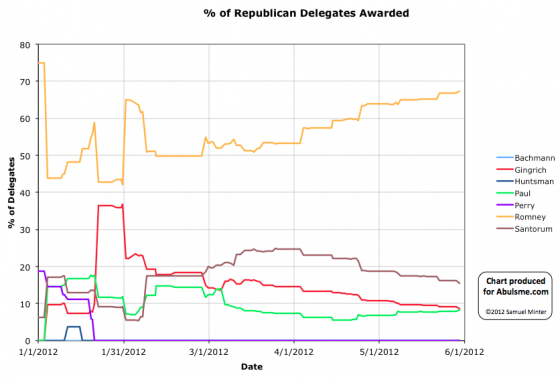
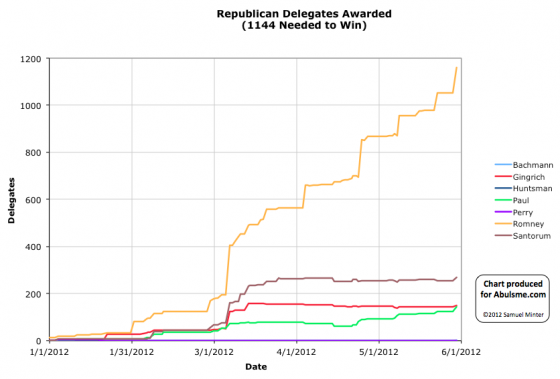
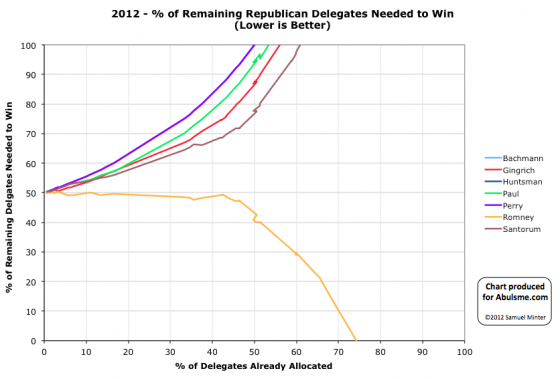
All of these charts show how Romney completely dominated this race from the very beginning. There was NEVER a point in the entire campaign where Romney was not ahead in delegates. It was only even close for a few days after Gingrich won South Carolina. The rest of the time, this whole campaign has just been a story of Romney slowly but surely pulling further and further ahead.
Now lets look specifically at today’s results from Texas.
Prior to today, none of Texas’s 155 delegates had been allocated. As of this update we have Romney 105, Paul 18, Santorum 13, Gingrich 7, Bachmann 2, TBD 10. Yes, that is right, at this late state, Michelle Bachmann mounts a comeback it seems. In any case, an overwhelming Romney win.
Romney also picked up two super delegates from Colorado today.
So net for the day: Romney +107, Paul +18, Santorum +13, Gingrich +7, Bachmann +2. Romney gets 72.8% of the delegates awarded today. This is way more than the 12.9% of the remaining delegates he needed to be on track to get to 1144 before “the end”. This was actually enough to push him over the edge.
My count now has the totals as: Romney 1159, Santorum 268, Gingrich 150, Paul 143, Bachmann 2
Now, by the Green Papers “hard count” that only counts delegates that are officially bound to Romney and theoretically have no discretion or ability to change their mind, we have Romney 1012, Santorum 245, Gingrich 143, Paul 93, Bachman 2, Huntsman 2… so by that count Romney still has a little bit further to go. The soft count also includes estimates for how delegates with discretion will vote and for how the remaining processes that are not yet final will play out. I also add in the super delegates who have publicly stated a preference. This is all reasonable. So I feel confident having using the count we have used all along, and considering Romney to have gotten to the 1144 magic number as of today.
Since we are hitting this major milestone today, I’ll take advantage of this time to highlight the comparisons with the 2008 races. More comparisons with 2008 can be found here.
First, to make comparisons easier, the 2012 race on a full 0%-100% scale:
Then what the equivalent graph looked like in 2008:
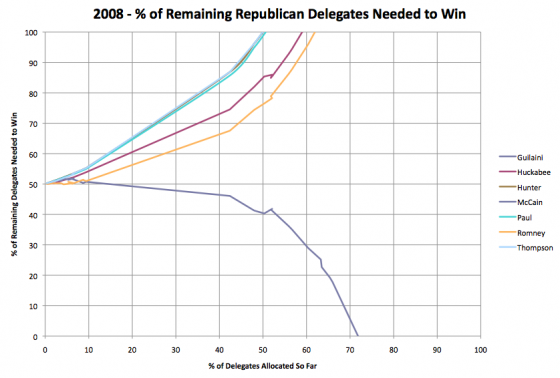
Looking at these two, in 2008 McCain had two non-trivial opponents compared to the 3 Romney had this time. In 2008, McCain pulled away from the other candidates starting around the 10% mark. In 2012 Romney was ahead from the very beginning. By the the 5% of delegates awarded mark (after Florida), Romney opened up the gap and none of the others ever came close again. Both Romney and McCain got to the “40% of remaining needed to win” mark at almost exactly the point where 50% of the delegates had been awarded. These two years look pretty similar.
Another view comparing Romney 2012 to McCain 2008 looks at % of total delegates earned by the eventual winner vs % of total delegates allocated. This was originally prompted by a post at Enik Rising. Looking at both candidates on the same chart we see this:
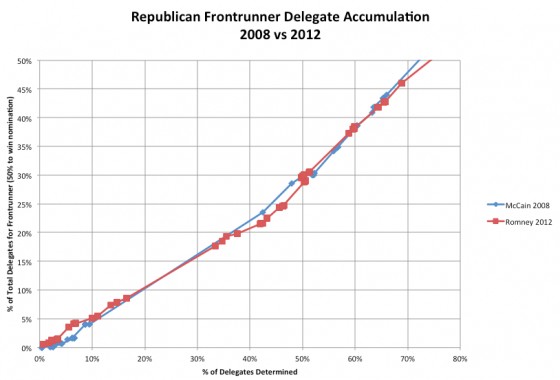
Despite all the talk at various points in time about Romney having problems closing the deal by comparison to 2008, this shows clearly that no such thing was happening. Any perception to that effect was due only to the fact that the calendar was more spread out this year than in 2008. Comparing the two curves, sometimes Romney was ahead, sometimes McCain was ahead, but for the most part these two lines tracked each other closely.
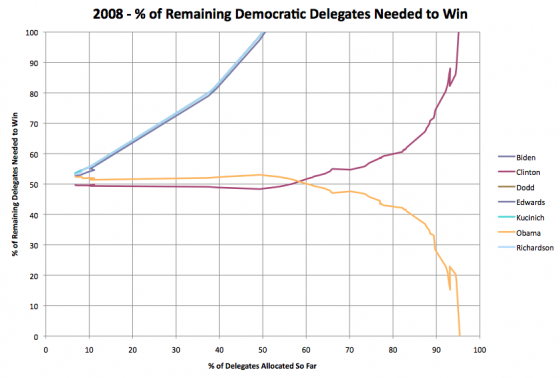
Finally, just for completeness, here is what an actually close race looks like on the “% of remaining delegates needed to win” chart… specifically, the Democrats in 2008:
With that, we wrap up the regular coverage of the Republican delegate race for 2012. There may be additional updates for specific milestones… if Paul manages to pass Gingrich in the delegate count… the final totals once all the state delegate selection processes are actually over… or the final roll call count at the convention… but as for regular updates this is it.
Thanks for everybody who has been reading and enjoying these updates over the last five months.
From here on out, it is all about the Electoral College…
Edit 2012 Jun 5 12:49 UTC: Fixed affect/effect typo.

Leave a Reply
You must be logged in to post a comment.