- MT @mseyfang: If Judd followed all the proper steps in the WV del selection process, he'd be entitled to 13 delegates in WV. O wld get 18. #
- Reading – Verizon Refuses to Identify Alleged BitTorrent Pirates (Ernesto,TorrentFreak) http://t.co/JczcHggF #
|
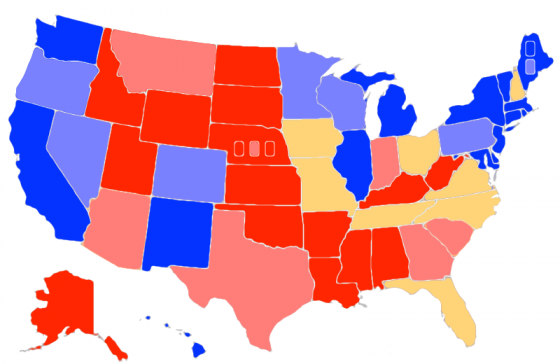
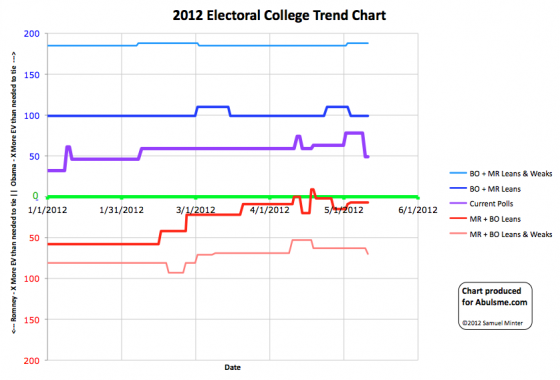
Chart and map from the Abulsme.com 2012 Electoral College Prediction page. Both assume Obama vs Romney with no strong third party candidate. Both show polling as it currently exists. Things will change before election day. On the map red is Romney, blue is Obama, gold states are too close to call. Lines on the chart represent how many more electoral votes a candidate would have than is needed to tie under several different scenarios. Up is good for Obama, Down is good for Romney. One state changing status today, and once again it is a move in Romney’s direction:
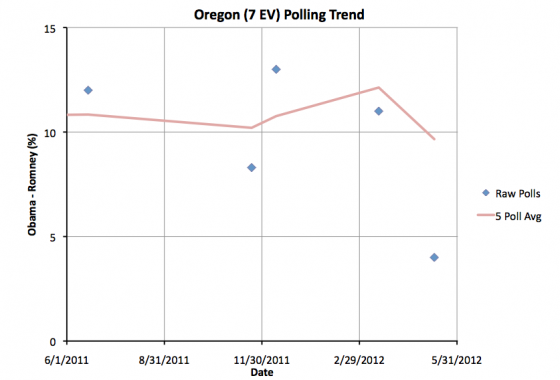
Obama’s lead in the five poll average drops from 12.1% to 9.7%. So we no longer classify it as “Strong Obama”, but rather “Weak Obama”. Now, the average is still well over 5% (despite the most recent poll) so Oregon is still nowhere near being a swing state. In the last year there hasn’t been a single poll showing Romney leading in Oregon. But the lead is no longer so big that Obama would be safe completely ignoring the state. Romney could cause some heartburn for Obama there if he put some effort into the state. There have also only been five Oregon polls in the last year. If additional polling shows the current status is closer to the most recent poll than the previous four, and Romney continues to make gains, then Oregon may well move into swing state status later in the race. Since Oregon is neither entering or leaving swing state status, the summary stays the same:
Edit 2012 May 20 06:30 UTC – Fixed Map, SC was incorrectly colored as a swing state, it is now correctly colored as “Weak Romney”. |
||||||||||||||


