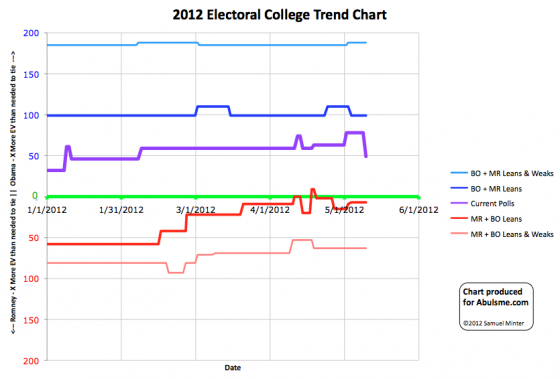
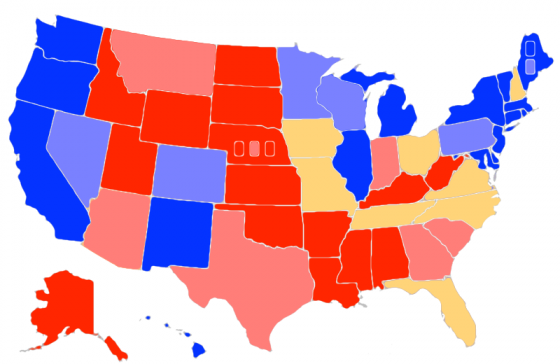
Chart and map from the Abulsme.com 2012 Electoral College Prediction page. Both assume Obama vs Romney with no strong third party candidate. Both show polling as it currently exists. Things will change before election day. On the map red is Romney, blue is Obama, gold states are too close to call. Lines on the chart represent how many more electoral votes a candidate would have than is needed to tie under several different scenarios. Up is good for Obama, Down is good for Romney.
One state changes status today, and it is a big one!
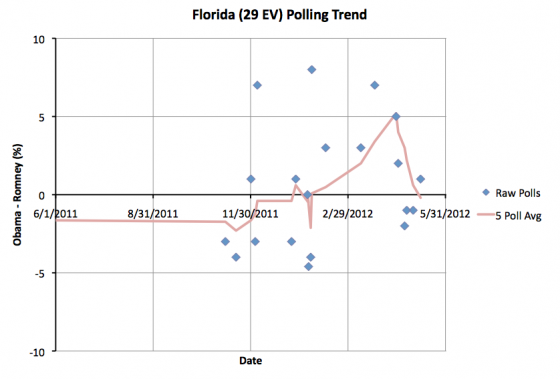
In my five poll average Florida moves from Obama up by 0.6% to Romney up by 0.2%. In either case, the bottom line is that Florida is too close to call and could go either way. The recent trend has been toward Romney though. We’ll see if Romney can pull Florida closer toward him, or if it remains a super close swing state. (Which is kind of what everyone expects.)
Anyway, a big state flips to the Romney side. This effects the “current” line by moving 29 electoral votes in Romney’s direction, but the “best cases” representing the range of possible outcomes stay the same:
| Romney | Obama | |
|---|---|---|
| Romney Best Case | 276 | 262 |
| Current Status | 220 | 318 |
| Obama Best Case | 170 | 368 |
I had said I wouldn’t mention national level polls much, but there has been a big enough move there lately to warrant another mention. In the last couple of weeks there has been a substantial move toward Romney in the national polls, with the RCP Average dipping to an Obama lead of as low as 0.2% on May 8th, although it is back to 1.3% as of today. So why do the state numbers still show a massive Obama lead?
There are two answers, one is of course that the election is based on the states, not the national popular vote, and they do not always move in lockstep. But frankly, they DO usually move together, and only tend to diverge much in really close situations. The electoral college just usually shows an “amplified” version of the separation between the candidates in the national popular vote.
The more important factor right now is the second answer. State polls are still slow. There are new national polls every day. Meanwhile even important close states like Florida are still getting polled only once a week or so. Most states are polled even less frequently. This means that any state by state analysis will take longer to react to changes.
If the race narrows significantly and stays narrowed, the state numbers will start showing that soon enough. (And state polling in close states will get increasingly frequent as we approach the election, so this lag will decrease dramatically later in the year.)
Edit 2012 May 10 15:56 UTC – Moved summary box earlier in post.
