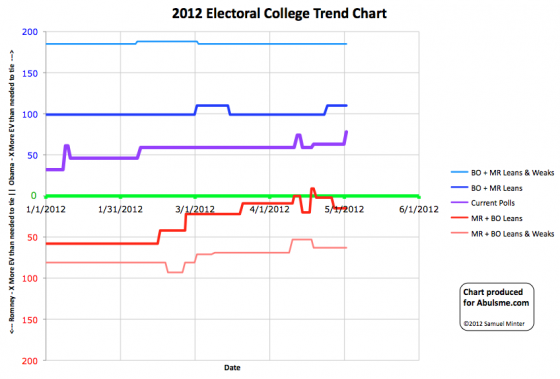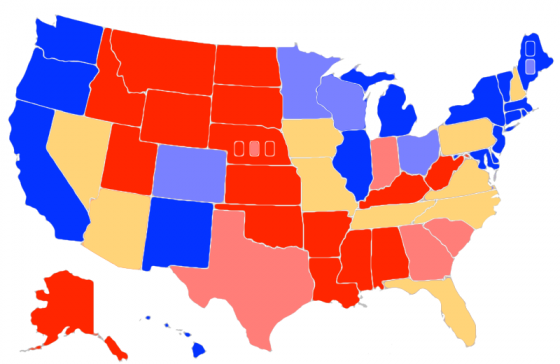

Chart and map from the Abulsme.com 2012 Electoral College Prediction page. Both assume Obama vs Romney with no strong third party candidate. Both show polling as it currently exists. Things will change before election day. On the map red is Romney, blue is Obama, gold states are too close to call. Lines on the chart represent how many more electoral votes a candidate would have than is needed to tie under several different scenarios. Up is good for Obama, Down is good for Romney.
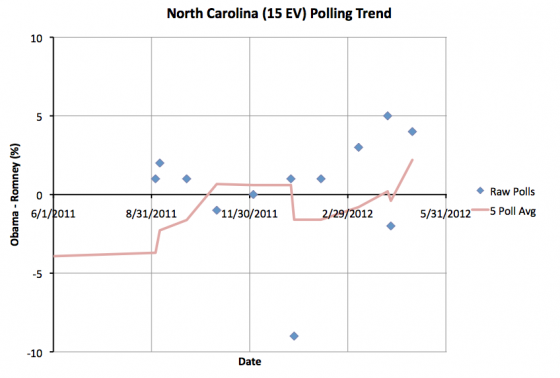
One change today in my categorization of states. North Carolina:

The last five polls go back to February, but now no longer include what now appears to be an outlier poll from Civitas in January that showed Romney up by 9%, so the five poll average pops upward and now sits at a 2.2% Obama lead. This leads me to classify North Carolina as “Leans Obama” again. But that lead is less than 5%, so really too close to call, and North Carolina stays a swing state in our model. As such, this only changes the “Current” line in our summary:
| Romney | Obama | |
|---|---|---|
| Romney Best Case | 284 | 254 |
| Current Status | 191 | 347 |
| Obama Best Case | 159 | 379 |
Leave a Reply
You must be logged in to post a comment.