This is the website of Abulsme Noibatno Itramne (also known as Sam Minter).
Posts here are rare these days. For current stuff, follow me on Mastodon
|
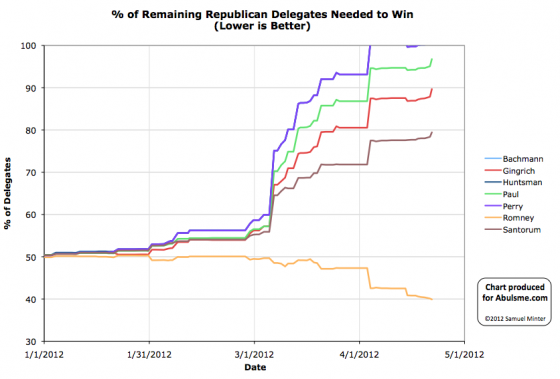
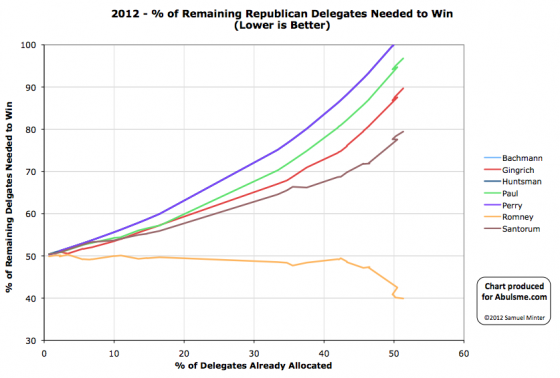
Charts from the Abulsme.com 2012 Republican Delegate Count Graphs page. When a candidate gets down to 0%, they have clinched the nomination. If they get above 100%, they have been mathematically eliminated. The first chart is by date, the second is by “% of Delegates Already Allocated”. These numbers include estimates of the eventual results of multi-stage caucus processes which will be refined as the later stages occur.
We finally have some results that aren’t just a handful of superdelegates, or minor revisions to a previous state’s tentative results. We have actual new results coming out of a state’s process. In this case, Missouri just finished its Congressional District Conventions, which allocate 24 of the state’s 52 delegates. (The rest will be determined at the State Convention on June 2, or are superdelegates.)
So… how did it turn out?
Romney 12, Santorum 7, Paul 4, Gingrich 1
With 50% of the delegates, Romney exceeds the 40.1% of the delegates he needed to be on pace to get to 1144. None of the rest come even close to the percentages they needed.
In terms of “% of Remaining Needed to Win”:
- Romney: 40.1% -> 39.9%
- Santorum: 78.4% -> 79.4%
- Gingrich: 87.9% -> 89.7%
- Paul: 95.1% -> 96.8%
Now, I’m sure Romney would have liked to have gotten significantly more than 50% here. But 50% will do. He’s comfortably on track to get to where he needs to be, and of course everybody else is still racing toward elimination.
Having said that, we should have the results from Minnesota’s Congressional District Conventions soon. Green Papers hasn’t finalized their results for Minnesota yet, and they haven’t been updating their totals based on the partial results that have been trickling out since March 31st, but they have been updating their notes on the process and all the indications are that… wait for it…
Ron Paul will walk away with more than 83% of the delegates from this stage of the Minnesota process… with Romney completely shut out, getting no delegates at all. Of course, Paul would need to be getting about 97% to be on a pace to catch up and win, but still… 83% is pretty impressive.
That is getting ahead of things though. We’ll talk about Minnesota once Green Papers updates their delegate total from the initial estimates they made after the caucuses in February. For the moment, that hasn’t happened yet.
(Edited 2012 Apr 24 05:44 UTC to add my standard intro paragraph which I had forgotten when I first posted this.)
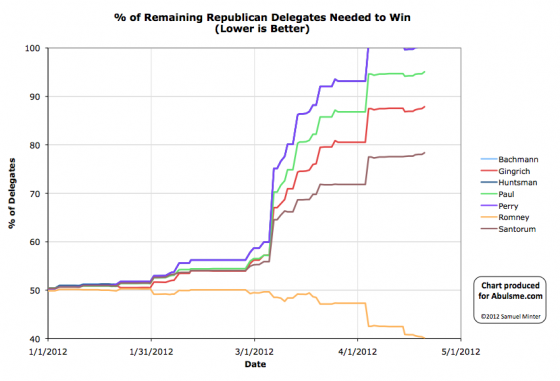
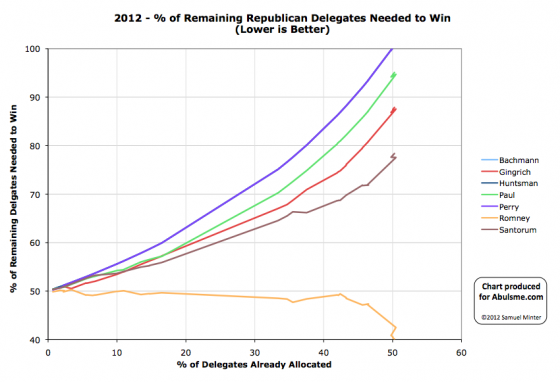
Charts from the Abulsme.com 2012 Republican Delegate Count Graphs page. When a candidate gets down to 0%, they have clinched the nomination. If they get above 100%, they have been mathematically eliminated. The first chart is by date, the second is by “% of Delegates Already Allocated”. These numbers include estimates of the eventual results of multi-stage caucus processes which will be refined as the later stages occur.
On Friday Romney had a meeting with the RNC, all of whom are automatic delegates to the convention and most of whom are superdelegates. (Some are not because their votes are bound by the primary or caucus results in their states.) If they wanted a picture with Romney, they had to sign a form saying they promise to support Romney at the convention. There are reports that over 100 of those present signed the form. Some of them checked a box asking that this fact not be made public because of elections they are running in, etc. Others said this could be made public. The Romney campaign hasn’t released those names yet. Maybe next week. So potentially there will be a big jump in Romney’s superdelegate numbers sometime very soon. In the mean time, DCW was able to verify five more superdelegates publicly endorsing Romney.
In terms of “% of remaining delegates needed to win”:
- Romney: 40.4% -> 40.1%
- Santorum: 78.0% -> 78.4%
- Gingrich: 87.5% -> 87.9%
- Paul: 94.7% -> 95.1%
And the march to 1144 continues. Romney now has 688. We still have a decent way to go.
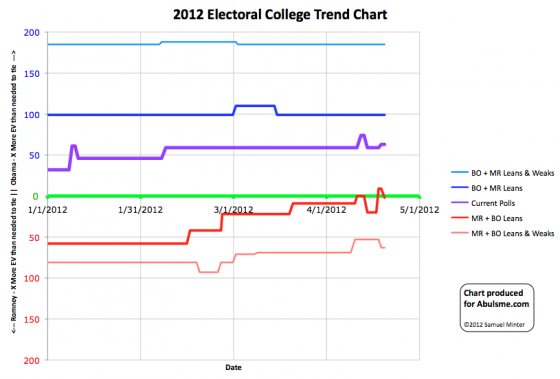
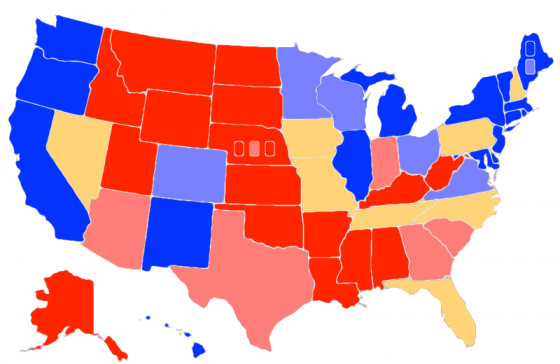
Chart and map from the Abulsme.com 2012 Electoral College Prediction page. Both assume Obama vs Romney with no strong third party candidate. Both show polling as it currently exists. Things will change before election day. Lines on the chart represent how many more electoral votes a candidate would have than is needed to tie under several different scenarios. Up is good for Obama, Down is good for Romney. On the map Red is Romney, Blue is Obama, Gold States are too close to call.
Two changes today based on new polls added to my master spreadsheet. And they both change the inventory of swing states, so important changes at that! Here are the details:
Florida (29 electoral votes): Just two days ago the five poll average moved Obama’s lead in Florida to over 5% (5.2%) and thus moved the state out of swing state status and into the “Weak Obama” category. Well, that didn’t last very long. Today’s update puts Obama’s 5-poll lead at 4.0%, so the state goes back into the “Lean Obama” category and is once again classified as a swing state for our model. Florida is big at 29 electoral votes, so makes a big difference in the electoral math.
Ohio (18 electoral votes): Meanwhile, Obama’s lead in Ohio goes above 5% to 5.2% in the five poll average. This removes Ohio from the swing state pool and moves it into the “Weak Obama” group. This means Obama has a decent lead at the moment, but not so big that it wouldn’t be worth Romney’s time to try to attack that lead and pull Ohio back to being a close contest. Ohio is one of those states that everyone expects to be close, so don’t be surprised if, like Florida, Ohio doesn’t stay in this status too long.
All and all since Florida is “worth more” than Ohio, today’s moves are good for Romney. And in fact, this once again makes it so if Romney wins all the swing states, he wins the election…
|
Romney |
Obama |
| Romney Best Case |
271 |
267 |
| Current Status |
206 |
332 |
| Obama Best Case |
170 |
368 |
While some states have moved in both directions, if we look at all the changes in April so far, Obama is still in a better position than he was at the beginning of the month. We still haven’t had enough state polls to detect the recent move in Romney’s direction over the last week and a half. If Romney hold his position in the national polls, expect more states to move in Romney’s direction over the next few weeks.
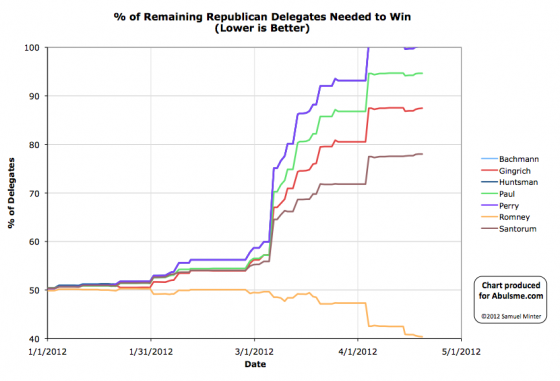
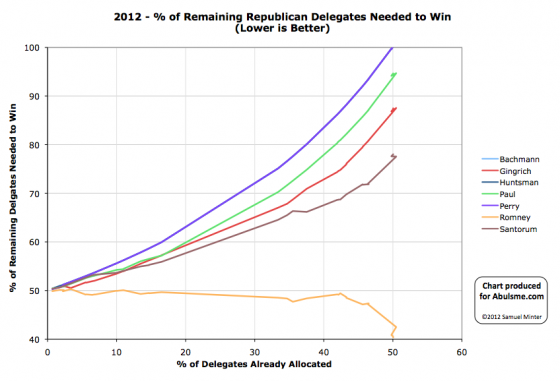
Charts from the Abulsme.com 2012 Republican Delegate Count Graphs page. When a candidate gets down to 0%, they have clinched the nomination. If they get above 100%, they have been mathematically eliminated. The first chart is by date, the second is by “% of Delegates Already Allocated”. These numbers include estimates of the eventual results of multi-stage caucus processes which will be refined as the later stages occur.
Another minor update as Green Papers gets final delegate numbers from Tennessee. Back in March the results from the Primary were reported as Santorum 29, Romney 16, Gingrich 10. The final results turned out to be Santorum 29, Romney 17, Gingrich 9.
So for the day: Romney +1, Gingrich -1
In terms of “% of remaining delegates needed to win”:
- Romney: 40.5% -> 40.4%
- Santorum: 78.0% (No Change)
- Gingrich: 87.4% -> 87.5%
- Paul: 94.7% (No Change)
Can we please have some primaries again? This slow dripping of minor delegate changes is killing me. :-)
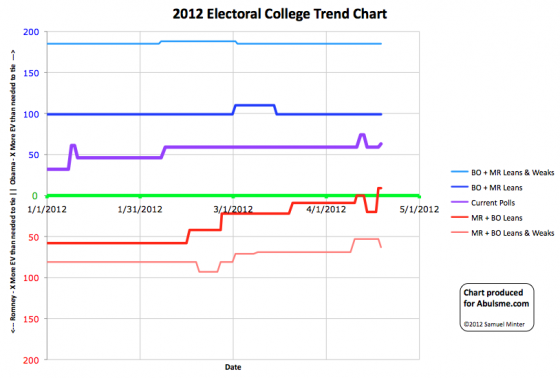
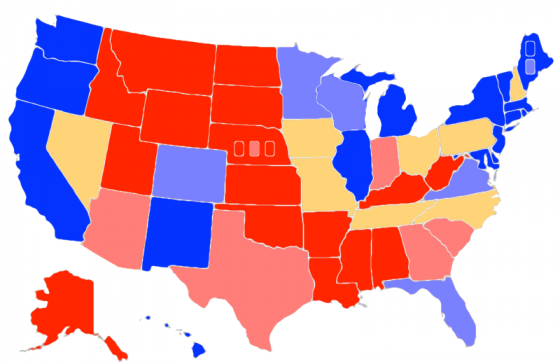
Chart and map from the Abulsme.com 2012 Electoral College Prediction page. Both assume Obama vs Romney with no strong third party candidate. Both show polling as it currently exists. Things will change before election day. Lines on the chart represent how many more electoral votes a candidate would have than is needed to tie under several different scenarios. Up is good for Obama, Down is good for Romney. On the map Red is Romney, Blue is Obama, Gold States are too close to call.
Two changes in our poll classifications today based on new additions to our five poll averages.
First, Obama’s lead in Wisconsin (10 electoral votes) drops to less than 10% bringing Wisconsin into the “Weak Obama” category. Since this is still not a swing state, our “Romney Best Case” scenario still doesn’t include Romney winning Wisconsin. But this does mean that Wisconsin is potentially in play. With the right combination of campaigning and events, Obama’s lead in Wisconsin could drop below 5%, putting it into contention as a swing state. It is not there today… Obama’s lead in the five poll average is still 8.8%… but it is close enough now to be worth spending time and money in the state.
Second, New Hampshire (4 electoral votes) moves from being just barely Romney to being just barely Obama. (Obama’s lead in the five point average is 1.7%, which is negligible and can disappear in an instant.) New Hampshire remains too close to call and therefore one of our swing states. But this does change our “everybody wins the states they are ahead in” scenario.
|
Romney |
Obama |
| Romney Best Case |
260 |
278 |
| Current Status |
210 |
328 |
| Obama Best Case |
170 |
368 |
Romney’s best case with current polling results remains a loss. And the “current status” improves for Obama because of New Hampshire.
But Wisconsin does show there is some movement in Romney’s direction at the moment. Over the last eight days we’ve seen Obama’s lead in RCP’s National Poll average drop from 5,4% to 1.7%. That is a very significant drop. We’ll see over the next few weeks as more state polls come in whether this starts to translate into electoral college gains as well. The expectation is that as long as the national poll trend is sustained, the state numbers will move correspondingly as soon as we have enough state polls to show it.
Edit 2012 Apr 19 07:10 UTC – Added number of electoral votes for each state mentioned.
Edit 2012 May 30 15:47 UTC – It turns out New Hampshire’s move from Lean Romney to Lean Obama should actually have happened on Mar 31. Details of correction and revised historical chart posted on May 30.
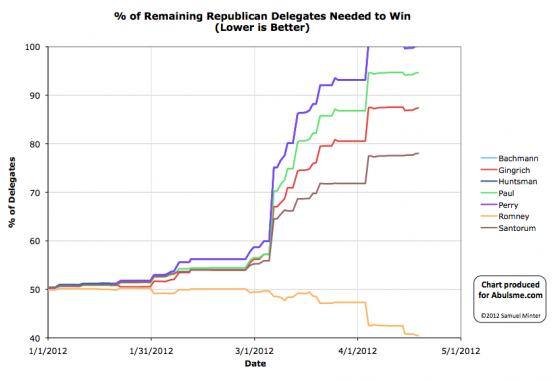
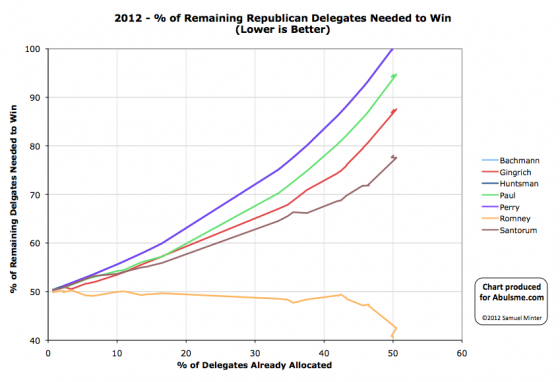
Charts from the Abulsme.com 2012 Republican Delegate Count Graphs page. When a candidate gets down to 0%, they have clinched the nomination. If they get above 100%, they have been mathematically eliminated. The first chart is by date, the second is by “% of Delegates Already Allocated”. These numbers include estimates of the eventual results of multi-stage caucus processes which will be refined as the later stages occur.
A couple minor updates today as we continue through the slow period before we have NY/PA/CT/RI/DE next week.
The totals for Alabama get updated from Santorum 23, Gingrich 14, Romney 11, 2 TBD to Santorum 23, Gingrich 13, Romney 12, 2 TBD. This apparently after resolving a dispute on the results in the 7th congressional district. So Romney +1, Gingrich -1.
Also, a superdelegate from Rhode Island endorsed Romney.
So for the day, Romney +2, Gingrich -1.
In terms of “% of remaining needed to win”:
- Romney: 40.59% -> 40.46%
- Santorum: 77.95% -> 78.02%
- Gingrich: 87.23% -> 87.39%
- Paul: 94.58% -> 94.66%
I know. Yawn. But we will track this to the bitter end. Look for much bigger moves next week.
|
|


