- Reading – The Real Lesson in Today’s Election Polls (John Sides) http://t.co/nRvlhsNd #
- MT @KenJennings: 9th circle of hell is serial torture-killers & child molesters & people who write words in their Draw Something pictures. #
- MT @DemConWatch: Still counting superdelegates, Romney's up 4 since last Thursday, 2 in NY, 1 in CO and CT, up to 37. http://t.co/pRyYtacs #
- Reading – Mixed Results for Romney in First Contests Since Becoming Presumptive Nominee (Josh Putnam) http://t.co/gbtPOcyM #
- Reading – Rubio, Pawlenty, Haley all say "not interested" to VP spot (Phillip Elliot) http://t.co/4WOAZJ8y #
- Reading – Baby found after horrific abduction from murdered mother (Juan A. Lozano) http://t.co/0YeONhnu #
- Reading – Secret Service's Colombia scandal has election-year implications (Julie Pace) http://t.co/Zszjc4Do #
- Reading – Steve Jobs & The Lost Years (Om Malik) http://t.co/PPYWkABt #
- RT @dooce: Righteously indignant about the idea of universal healthcare? Go read @xeni's twitter stream and get back to me. #
- Reading – Yes, CISPA Could Allow Companies to Filter or Block Internet Traffic (Dan Auerbach & Mark M. Jaycox) https://t.co/n3YYQ6v6 #
- Reading – Heave. Retch. Repeat. (Andrew Sullivan) http://t.co/6cTNuwDM #
|
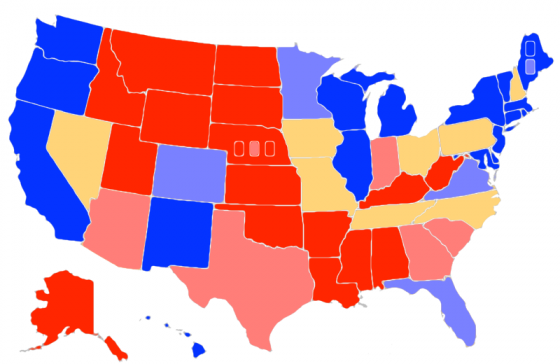
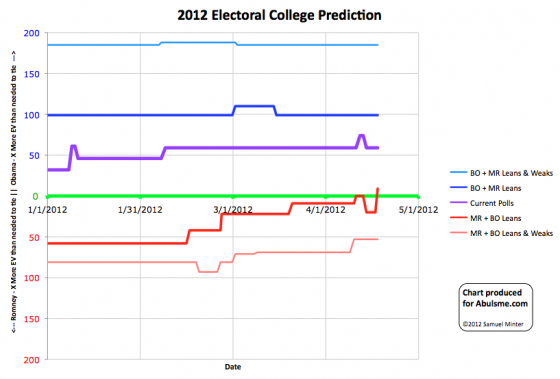
Map and chart from the Abulsme.com 2012 Electoral College Prediction page. Both assume Obama vs Romney with no strong third party candidate. Both show polling as it currently exists. Things will change before election day. On the map Red is Romney, Blue is Obama, Gold States are too close to call. Lines on the chart represent how many more electoral votes a candidate would have than is needed to tie under several different scenarios. Up is good for Obama, Down is good for Romney. Remember how a few days ago I said things were starting to improve for Romney? Well, that didn’t last long… Obama’s lead in the five poll average for Florida increases to over 5%. It leaves the swing states and moves to “Weak Obama”. My “best case scenarios” give one candidate or another all of the swing states. Florida makes a big difference. So what do things look like now?
Yes, that is right. With current state polling, if Romney wins ALL of the states that are close… He still LOSES 260 to 278. There are major caveats to give:
Despite this, it is remarkable for Obama to be showing this kind of lead. Romney has a lot of work to do. But wait…. haven’t there been polls in the news lately showing Romney ahead? What is going on? First, never pay attention to individual polls. Instead look at one of the places that aggregate. Lets look at RCP’s Average. Obama’s lead was usually between 4% and 6% from February until April. It was 5.3% on April 10th. It declined to 2.4% on April 14th. This dip is eight days old. Too short to be picked up in state polls. The projection here is consistent with the lead Obama showed until the last few days. If the new trend is sustained, it will show up in the state results soon. Second, the president is not elected by popular vote. It doesn’t matter if Obama is ahead in California by a little more or less. Obama will win California. But that will show up in national polls. Popular vote and electoral college will only diverge in close elections, but the election is decided by the electoral college. Look at the popular vote polls as leading indicators, but in the end, look at the electoral college. That is how Presidential elections work.
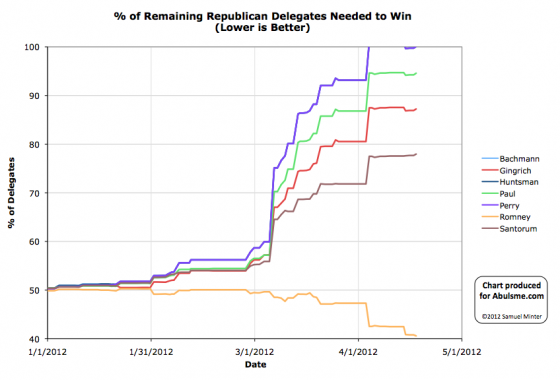
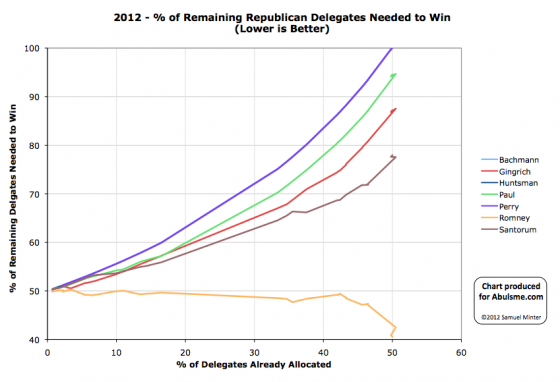
Charts from the Abulsme.com 2012 Republican Delegate Count Graphs page. When a candidate gets down to 0%, they have clinched the nomination. If they get above 100%, they have been mathematically eliminated. The first chart is by date, the second is by “% of Delegates Already Allocated”. These numbers include estimates of the eventual results of multi-stage caucus processes which will be refined as the later stages occur. Over the last week DCW counted four new Romney superdelegates. Two from New York, one from Colorado, and one from Connecticut. Four delegates is of course minor at this point and everybody knows the nominee is Romney, but we will continue posting updates until Romney actually gets to 1144. By the estimates I am using, he now has 680. In terms of “% of remaining needed to win” this update gives us:
This also puts us once again above 50% of the total delegates, which means anybody with no delegates at all is now once again eliminated absent the four candidates above losing delegates from their estimated totals (which can of course happen in various ways). So Bachman, Huntsman and Perrry… sorry about that. The rest of this post is a note for anybody interested in the nitty gritty details of how I come up with my counts. Everybody else can stop reading now. :-) When I started producing these charts in January I used Green Papers as my only delegate count source (specifically the soft count). Very soon after that I realized Green Papers wasn’t including super delegate endorsements, so I started adding in the superdelegate counts from DCW. Then a bit later on Green Papers started folding in the DCW numbers themselves, so I stopped separately adding them, and just used Green Papers count directly again. Sometimes there would be a day or two delay between DCW adding a Superdelegate and Green Papers incorporating that new information, but that wasn’t too bad. It seems like Green Papers is getting a bit further behind now though. As of this post they hadn’t yet added the superdelegates DCW added on the 11th, 12th and 16th. So I figure until they catch up, I’ll manually add the DCW numbers again. This update catches us up to DCW’s super delegate count and puts the Romney numbers here slightly ahead of what Green Papers is currently showing. |
||||||||||||||


