- Reading – The Government’s Case Against Apple And E-Book Publishers (Carl Franzen) http://t.co/uNaOcxBx #
- Reading – Hailing Frequencies Open? Communication Via Neutrinos Tested Successfully (Nancy Atkinson) http://t.co/zyPCOeb0 #
- Reading – PM: Turkey may invoke NATO’s Article 5 over Syrian border fire (Ekrem Dumanli) http://t.co/1QcPToem #
- Reading – Gingrich Unloads on Fox News in Private Meeting (Scott Conroy) http://t.co/catQLJN8 #
- MT @StudioXNYC: 4square rep says "Privacy is a modern invention" as if ends debate on ethics. Someone in audience yells "So is sanitation!" #
- Reading – Hi Roger. It's Me, Joe: The Fox Mole (Joe Muto) http://t.co/E8qZ4z3s #
|
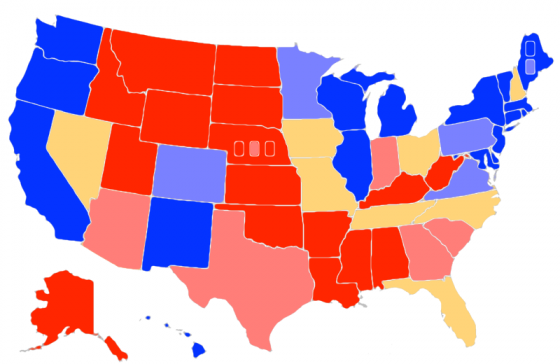
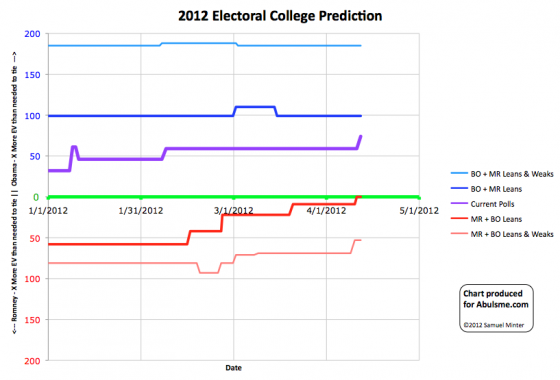
Map and chart from the Abulsme.com 2012 Electoral College Prediction page. Both assume Obama vs Romney with no third party strong enough to win states. Both show the polling situation as it currently exists. Things can and will change before election day. On the map Red is Romney, Blue is Obama, Gold States are too close to call. Lines on the chart represent how many more electoral votes a candidate would have than is needed to tie under several different scenarios. Up is good for Obama, Down is good for Romney. The latest polls move my five poll average in North Carolina from barely Romney to barely Obama. The reality is that the margin is still essentially too close to call (Obama ahead by 0.2%). North Carolina is firmly a swing state at the moment. So this doesn’t change the range of possibilities between Obama getting all swing states and Romney getting all swing states… but it does move our “everybody gets the states they are ahead in” line further toward Obama. In this case, we have Obama now winning 343 to 195. This is the third change in three days in Obama’s favor. The summary:
Edited 2012 Apr 12 21:24 UTC to replace an errant “McCain” with the intended “Romney”. Thanks JH for pointing out the error. |
||||||||||||||

