- RT @DemConWatch: Real LA delegate battle tonight: GreenPapers vs FHQ . Anybody have a reference on what AP says? #
- MT @TheGreenPapers: Apparently, there has emerged at least some confusion as to how the 20 LA dels will be split http://t.co/7LdTG0yw #
- Reading – Recap LA-D and LA-R Presidential Primaries. MO-R Caucuses. 1 change to the candidate list (Tony Roza) http://t.co/Y9vjoatv #
- Reading – So you want to get into a Ph.D. in political science Ph.D. program, Episode II (Daniel W. Drezner) http://t.co/0xX3nzl7 #
- Reading – AOL kills AIM (Dustin Curtis) http://t.co/oeNApBZe #
- Reading – Trayvon's killer a cop wannabe on paranoid patrol (Pedro Oliveira Jr & Gary Buiso) http://t.co/YPTfSQtF #
- RT @RQDammit: Im wearin a hoodie, Don't Shoot! http://t.co/7D9cHB64 #
- MT @PaulGAllen: Now on the bottom 35755 ft!! Plan is 4 #Deepseachallenge to spend 4-6 hours on the seabed – Huge Congrats what a relief!!! #
- MT @drunkenpredator: Cameron is live-tweeting his dive to the deepest ocean trench. I can't wait for the part when Godzilla eats his sub. #
- RT @brainpicker: Baby owls. In teacups. And between books. Enough said http://t.co/TQopekIY #
|
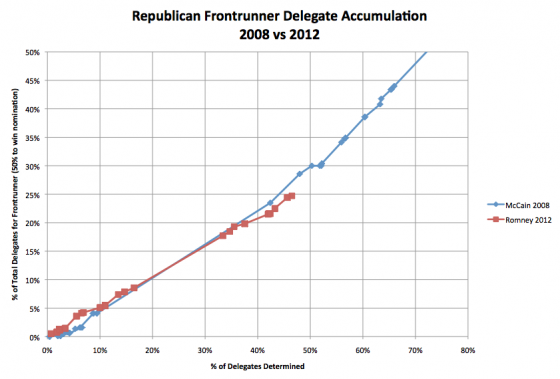
I had promised an update of the 2008 vs 2012 frontrunner graph after Louisiana. I had thought we would have about 52% of the delegates allocated (or estimated) at this point, but I was wrong. States responsible for about 52% of the delegates have “started their process” according to Green Papers, but not all of those delegates are determined yet, for a variety of reasons. Instead, we are only at about 47%. 52% is a good place to compare because that is where things were in 2008 right after Super Tuesday was all settled. In 2008 we were closest to the 47% mark on February 7th, which was after Super Tuesday, but still with only partial results from those contests. So the comparison will be better after we get past that point. In any case, here is the update after Louisiana: Romney is still behind McCain’s pace four years ago, but not by very much. It isn’t a dramatic difference. It just FEELS like it is because of the very different calendars in 2008 vs 2012. But really, the two candidates are tracking each other pretty closely by this analysis. The chart by Seth at Enik Rising still shows a much bigger apparent difference. (As of when I write this, he has updated for Illinois, but not Louisiana.) In my previous analysis I’d determined that the two graphs actually have very similar data. The difference in how they are perceived is due to three main factors:
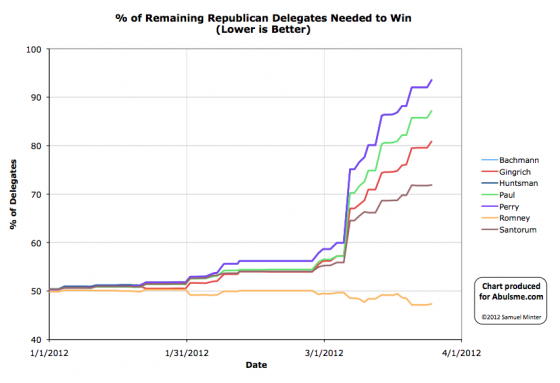
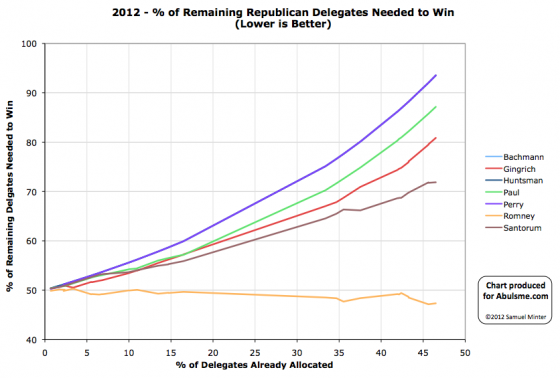
Anyway, interesting to look at the data in these two different ways. DC, Maryland and Wisconsin happen on April 3rd… all winner take all. There are no polls in DC and Maryland, but those don’t seem like Santorum country. The most recent poll in Wisconsin, a Rassmussen poll (the only one taken in March so far) has Romney ahead. If Romney does win all three of those contests, we’ll be at 51% of the delegates allocated (or estimated) and Romney will ALMOST have caught up to McCain’s pace in 2008. (Romney will have 29% of the total delegates, where at the comparable point McCain had 30%.) We’ll see if that is how it plays out. I’ll do another update of this chart after we have those results. Charts from the Abulsme.com 2012 Republican Delegate Count Graphs page. When a candidate gets down to 0%, they have cinched the nomination. If they get up past 100%, they have been mathematically eliminated. The first chart is by date, the second is by “% of Delegates Already Allocated”. These numbers include estimates of the eventual results of multi-stage caucus processes which will be refined as the later stages occur. So, Santorum has a “big win” in Louisiana. But, unfortunately for him, not big enough. Green Papers’ Louisiana Results give 13 delegates to Santorum and 7 to Romney. Gingrich and Paul get nothing. Louisiana also has 26 more delegates that will be determined by other means. (Note that there is some question on interpretation of the delegate rules. @FHQ says 10 Santotum, 5 Romney and some uncommitted delegates. We use Green Papers as our source, and they will update if it becomes clear their interpretation of the rules was wrong.) So with a 13-7 split, that is 65% Santorum. To actually be on a pace to catch up and win, he needed to get 71.8% of the delegates. Didn’t happen. Thus with his “big win” Santorum still moves closer to mathematical elimination. That is some win! Of course, Romney also didn’t get the delegate levels he needed to be on the pace he needs. He needed 47.1% of the delegates. The 35% he gets with his 7 delegates is well below that. So, it’s an “everybody loses!” day. Bottom line is that Louisiana doesn’t change much. The three non-Romney’s are racing inevitably toward elimination. They are just too far behind to catch up absent something as major as Romney dropping out of the race… which I don’t think Romney is thinking about doing at this point. Meanwhile, Romney is in a position to eventually win just by continuing to collect delegates at the same pace he has been. Romney has collected 53% of the delegates so far. If he just keeps chugging at those margins, he’ll get to 1144 eventually. But… the non-Romney’s collectively have gotten 47% of the delegates. If they can up that to 53%, then they can still collect enough delegates to block Romney. 47% to 53% is a big move in a political race. But it is still not out of the realm of the possible. (It is getting close though.) A few big slips by Romney. One of the non-Romney’s doing something really impressive. It COULD happen. It is unlikely though. As I’ve said before here, as it becomes clear that none of the non-Romney’s can actually win, it will be harder and harder for them to actually get delegates. So it is far more likely that the percentage of delegates the non-Romneys can manage will decline as we go forward. “% of remaining needed to win” update based on today’s numbers:
We’re still not quite to the half way mark. 46.5% of the delegates allocated (or estimated) at this point. Next up: DC, Maryland, Wisconsin on April 3rd. All winner take all states, so likely to have a bigger impact. |
||


