- Reading – Rick Santorum’s Illinois Comedy of Errors (Molly Ball) http://t.co/FghHBsML #
- Reading – Forget the Money, Follow the Sacredness (Jonathan Haidt) http://t.co/mb55M5QT #
- Reading – In Illinois, Santorum’s Chance at Nomination Is Slipping Away (Nate Silver) http://t.co/Ewf1slVp #
- @smotus Diff # total dels in 2008 and 2012. Need to look at % of dels not raw #. See http://t.co/DhBUz6Wi for chart. cc @DemConWatch @FHQ #
- BuhBye NYT MT @mlcalderone: In April, NYT moving pay gate at http://t.co/pYD0jSly from 20 free articles a month to 10 #
- NYT Links frm email search blogs & social media able to access individual articles, even above limit. So never mind. http://t.co/nl5yAcCb #
- Reading – A Look at Today’s Illinois Primary Delegates and Allocations (Oreo, DCW) http://t.co/RoCp0wfk #
|
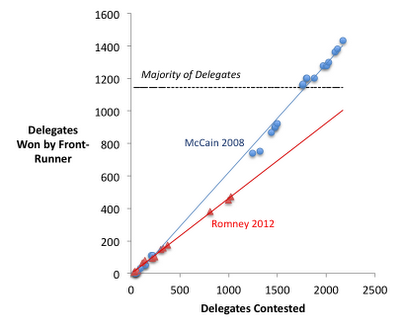
I had previously talked about the comparisons between the 2012 and 2008 Republican races here, here and here. The last of those is the most relevant, and if you haven’t checked it out before, feel free to go back and do so now. :-) In any case, a few hours ago I saw this tweet from @DemConWatch. It links to the article below. I’ve quoted the key conclusion, but please click through and read the whole thing. Romney, McCain, and the long slog to 1,144
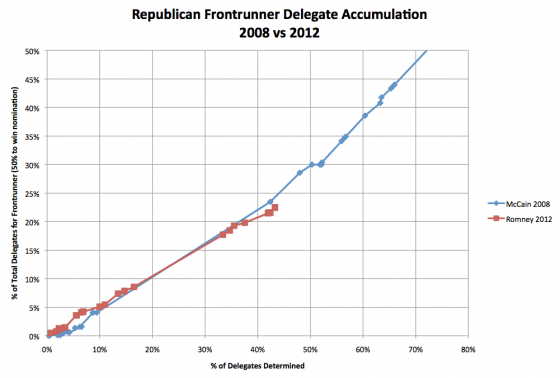
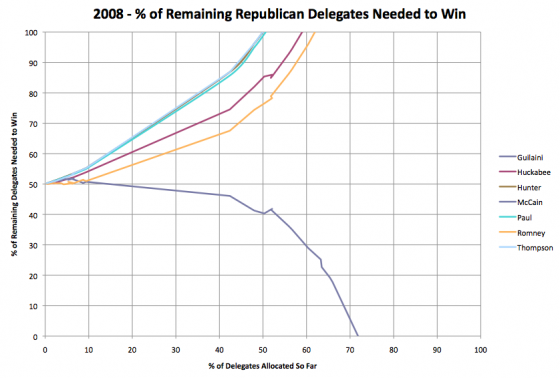
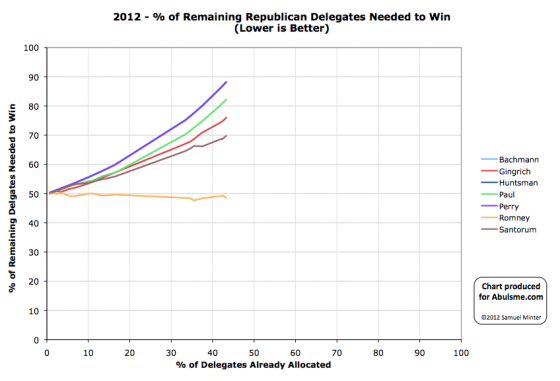
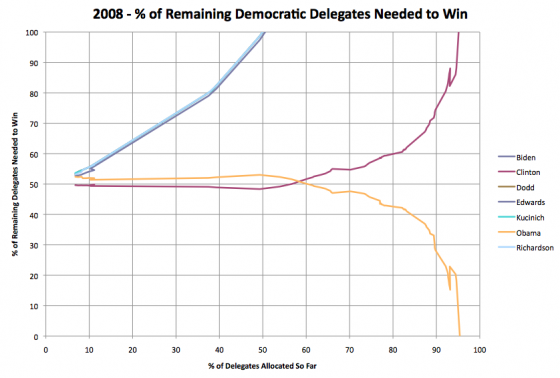
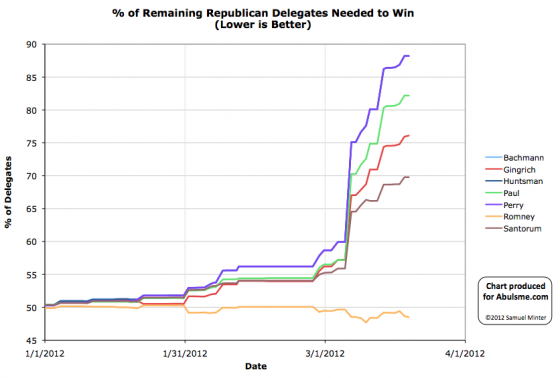
The thing I immediately noticed… the total number of delegates was different in 2008 and 2012! In 2008 there were 2380 delegates total. In 2012 there are only 2286! So using absolute numbers of delegates on the axes is not doing a direct comparison. You need to look at these as percentages of the total number of delegates available. So I redid the chart on that basis, using the data I had collected in my 2008 Delegate Race Page (which used CNN’s delegate counts, grabbed and put into a spreadsheet on a daily basis) and which I am now collecting in my 2012 Delegate Race Page (which uses the Soft Count from Greenpapers including DCW’s Superdelegate numbers also grabbed daily for a spreadsheet). Now, both my 2012 and 2008 numbers include so called “fantasy delegates” projecting the eventual results from caucus states, etc, which many folks argue is not the right way to track delegates, but since both years followed that practice, it seems like a valid comparison. In any case, the result is this: Romney is indeed behind McCain’s pace, but only very slightly, and that only developed in the last few contests. For most of the race so far, the pace of the two candidates tracked very closely, with Romney actually being ahead of McCain’s pace until Super Tuesday. He certainly is not as far behind as he appeared in Seth’s chart from Enik Rising. Rather, once you correct for both the calendar changes and the differing number of delegates, we see that the whole narrative of Romney being much slower to wrap things up than McCain was four years ago just falls apart. I’ll note that using the Green Papers count instead of the RCP Count that Seth used puts Romney slightly BETTER than the pace he needs to get to 1144 rather than slightly worse than that pace. And indeed, which sources you use for both the 2008 and 2012 delegate counts probably matters here. Given how much the various estimates vary I imagine how far the two lines are from each other may be quite different based on which delegate counts you use… but the above is what I get using the sources I chose to use for tracking in these two cycles. I’ll also use this opportunity to update the comparison between 2008 and 2012 using the metric I prefer… “% of remaining delegates needed to win”. This hits 100% once a candidate is mathematically eliminated or hits 0% once they have the needed number of delegates to secure the nomination. In 2008 on the Republican side the chart of this number for the various candidates looked like this: As of right now in 2012 (a few hours before the March 20th Illinois primary) this looks like this: Comparing these, as with the other chart, you can see that McCain in 2008 was indeed a bit better off at this point than Romney is this time around, but not by a huge margin. Using the sources I noted above, as of today 43.3% of the delegates have been allocated (or at least estimated in the case of those pesky fantasy delegates). As of today Romney needs 48.5% of the remaining delegates to wrap up the nomination. The closest equivalent day in 2008 would have been February 6th 2008 (just after Super Tuesday, with incomplete delegate results from those contests as results trickled in over several days) with 42.4% of the delegates determined (or estimated). At that point McCain needed 46.1% of the remaining delegates to win. Unquestionably better than Romney today, just not by a HUGE margin yet. In any case, the massive perception difference in terms of how well Romney is “wrapping it up” in 2012 compared to McCain in 2008 is almost all due to the spread out calendar. In reality, Romney is actually only a little bit behind McCain’s pace four years ago. It just SEEMS like he is much much further behind due to the fact it is the end of March at this point rather than the beginning of February which is when we were at the equivalent point in the delegate race back in 2008. Finally, just for an additional comparison, here is the same graph for the Democrats in 2008… (Minor wording edits and fixes were made in the 90 minutes or so after posting.) Chart from the Abulsme.com 2012 Republican Delegate Count Graphs page. When a candidate gets down to 0%, they have cinched the nomination. If they get up past 100%, they have been mathematically eliminated. Note that these numbers include estimates of the eventual results of multi-stage caucus processes which will be refined as the later stages occur. A minor update from Georgia today. My primary source, Green Papers, previously had the results from Georgia as Gingrich 54, Romney 19, Santorum 3. This has now been updated to Gingrich 52, Romney 21, Santorum 3. So the net for the day is Romney +2, Gingrich -2. So Romney’s “% of remaining needed to win” drops from 48.7% to 48.5%. (And Gingrich’s rises from 75.9% to 76.1%.) This is a minor change that does not change the state of the race significantly. But since there is an update today, it gives me a chance to modify something I said in the last update based on new information. I had said:
Well. two things. First, recent polls have been moving in Romney’s direction over the last week. The most recent poll as of this writing was a poll from PPP (pdf) that has Romney at 45%. Now, polls predict popular vote, not delegates, and the 48.5% Romney needs is a percentage of delegates, not a percentage of the popular vote. But assuming at least some correlation between popular vote and delegates, those numbers are getting pretty close to each other. Which brings us to… Second, Santorum failed to properly file for delegate slates in some parts of the state. This means that Santorum’s delegate take will almost certainly underperform his performance in the popular vote. This implies that Romney’s delegate take may well overperform his popular vote number. With these two factors together, Romney’s chances of getting to the 48.5% he needs to improve his “% of remaining” number and move closer to the nomination and further away from the scenarios where he doesn’t get to 1144 is much more likely than it looked previously. By this time tomorrow, we should know how that turned out. |
||
