- Reading – Skydiver jumps 13.6 miles on path to world's highest jump (Marcia Dunn) http://t.co/4svkQvA5 #
- Reading – Rare Bunny is Victim of The Media (Alex, Neatorama) http://t.co/sddX4Ltk #
- Reading – Obama Smears Rutherford B. Hayes, America’s Greatest President (Jim Newell) http://t.co/2VGHPk4W #
- Reading – Meghan McCain to Playboy: I’m вЂStrictly Dickly’ (Rebecca Schoenkopf) http://t.co/aA0t4qbt #
|
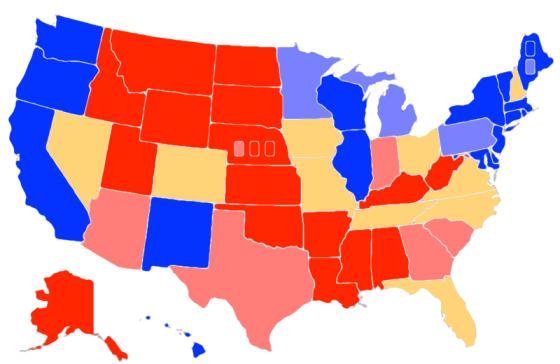
Map from the Abulsme.com 2012 Electoral College Prediction page. This map reflects Obama vs Romney. If any other candidate takes the lead in the Republican delegate race we’ll switch to making maps for them. This reflects the current state of polling, which of course will change drastically as the campaign progresses from now until November. The latest update in my five poll averages puts Romney’s lead in Arizona over 5%, so the state moves out of the “Lean Romney” swing state status to “Weak Romney” indicating Romney’s lead is more than 5% but less than 10%. This moves Arizona out of the list of states that could easily go either way, and reduces the margin in Obama’s “Best Case” Scenario.
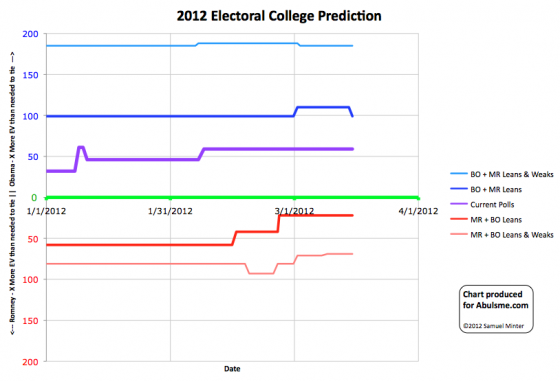
And the trends over time… Chart from the Abulsme.com 2012 Electoral College Prediction page. Lines represent how many more electoral votes a candidate has than is needed to tie under several different scenarios. This chart reflects Obama vs Romney. Lines moving up indicate Obama’s situation improving, lines moving down indicate Romney’s situation improving. If any other candidate takes the lead in the Republican delegate race we’ll switch to making charts for them. |
||||||||||||||

