- Watching – Matt Smith Top Gear 2012 Star in a Reasonably Priced Car (doctorwhotvcouk) http://t.co/lWF2p3fm #
- Watching – The Briggs-Rauscher Iodine Oscillator (mrhomescientist) http://t.co/LSwOAoRR #
- Reading – WikiLeaks begins publishing 5 million emails from STRATFOR (WikiLeaks) http://t.co/gAM8wf64 #
- Watching – Brave trailer – Disney Pixar (WaltDisneyStudiosAU) http://t.co/E95zQ0Uz #
- Reading – Did Jeb Bush Actually Say That? (Joe Klein) http://t.co/aygW7cwR #
- Reading – Romney’s New Tactic: Yes I’m Rich, And That’s A Good Thing (Pema Levy) http://t.co/IH5Tgxc5 #
- Reading – Why On Earth Am I Sympathizing With Santorum? (Andrew Sullivan) http://t.co/GbG8VHU5 #
- Reading – Foreclosure settlement a failure of law, a triumph for bank attorneys (Barry Ritholtz) http://t.co/pd3ykKsH #
- Watching – Drive Across Mongolia in 4 Minutes (Spots Unknown) http://t.co/01cZMPhe #
- Reading – Michigan Looking Good for Mitt (Josh Marshal) http://t.co/ftmZbgXG #
- RT @ppppolls: The Michigan numbers are good news for Romney, but the Arizona ones will be REALLY good news. Up in an hour to hour and a half #
- RT @fivethirtyeight: Santorum is up substantially in our first forecast of Tennessee, which votes on Super Tuesday. http://t.co/cJO5V4NA #
- RT @pourmecoffee: They left SOPA off the In Memorian clip. #oscars #
- Just completed a 1.44 km walk – Walking Roscoe. http://t.co/vRZoTGm3 #RunKeeper #
- RT @fivethirtyeight: Our model now has Romney at 99% to win Arizona based on new polling showing him pulling away there http://t.co/pQLKCaI7 #
- MT @fivethirtyeight: Romney up to 77% to win MI after adding WeAskAmerica poll. http://t.co/bTb8RITM #
- Readibg – Amazon seeks special designation for planned expansion (Jeanne Jones) http://t.co/2V8xlrJs #
- Reading – Republicans Determined Not to Get Fooled Again (Kevin Drum) http://t.co/T3MVs9G3 #
- Reading – What вЂleft’ and вЂright’ really mean (Ezra Klein) http://t.co/8VbBWoP2 #
|
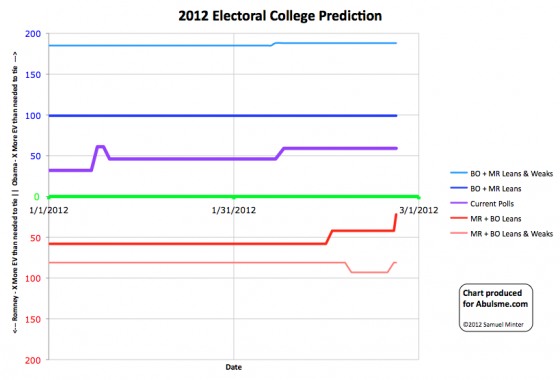
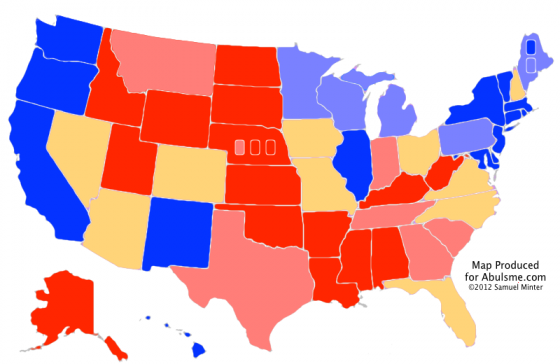
Chart from the Abulsme.com 2012 Electoral College Prediction page. Lines represent how many more electoral votes a candidate has than is needed to tie under several different scenarios. This chart reflects Obama vs Romney. If any other candidate takes the lead in the Republican delegate race we’ll switch to making charts for them. This is a big one today. Obama’s 5 poll average in Pennsylvania is now more than a 5% lead. This means I take Pennsylvania out of swing state status. It is no longer “too close to call”, it is blue. This reduces Romney’s best case (win all the swing states scenario) to only a 291 to 241 win. It is still a win, but his best case is now a vey narrow win, only 22 electoral votes past the 269 needed to tie. That turns Florida into a “Must Win”, as without winning Florida, there is no longer a way to get to 269. (At least without reaching past the swing states and pulling back states where Obama is even further ahead.) New summary:
And new map… Map from the Abulsme.com 2012 Electoral College Prediction page. |
||||||||||||||

