- Reading – Romney's Path to a Michigan Comeback (Katrina Trinko) http://t.co/r5jKwbDk #
- Reading – Microsoft's Biggest Miss (Patrick Rhone) http://t.co/RUBbOZzj #
- Reading – Santorum: Obama's worldview upside-down (Leigh Ann Caldwell) http://t.co/g1IQJgur #
- Reading – VLC hits 2.0 (Cory Doctorow) http://t.co/MKovxRyW #
- RT @joshtpm: Obama new campaign pitch distilled to 7 words. "GM is alive; bin laden is dead" #
- Reading – The Odd Existence of Point Roberts, Washington (Nate Berg) http://t.co/L6X1wvcn #
- Reading – Dick Cheney Has Been Lobbying For Gay Marriage In Maryland (Matt Stopera) http://t.co/eWIJSuEp #
- Reading – Legislators aim to turn states into broadband backwaters (Craig Settles) http://t.co/PXbWzA7Y #
- Reading – Oh my God, entertainment industry people are still pitching for SOPA (Rob Beschizza) http://t.co/emRfYOTU #
- Reading – Rick Santorum's Crazed Attack on Prenatal Screening (Charles Johnson) http://t.co/DDQVRiUn #
- Reading – A GOP nightmare scenario (Greg Sargent) http://t.co/zmlfg3M1 #
- Reading – Republicans Do NOT Understand Technology (DocJess, DCW) http://t.co/AQBC7oL8 #
- Reading – DRM gives companies security — from competition (Cory Doctorow) http://t.co/QKRCuzIp #
- Reading – Rush Limbaugh Leads GOP In Pondering How To Deal With Improving Economy (Benjy Sarlin) http://t.co/eVPOLRAd #
- Reading – Not Being Able to Scrape By With $200k Is Usually Your Own Fault (John Scalzi) http://t.co/57FlCXXl #
|
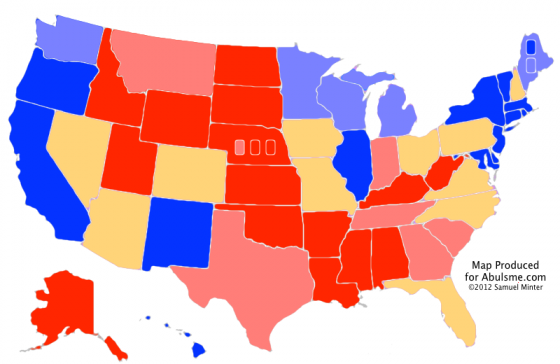
Map from the Abulsme.com 2012 Electoral College Prediction page. So, a new poll in Washington state moves Obama’s 5 poll average from a lead just a little more than 10%, to a lead just under 10%. To be fair, this is the 5th real poll I have, so this for the first time moves the 2008 election results used to seed the averages out, and makes this the first look that is based solely on Obama vs Romney polling. It does though move Washington from the “Strong Obama” category down to my “Weak Obama” category. I keep thinking maybe I should rename the categories, because a 9.5% lead isn’t exactly all that “Weak”. But leads that size have been known to disappear via strong campaigning, major events in the campaign, etc. The right way to interpret this category is “Candidate has a decent lead, but not so huge they can take the state for granted.” My name just sucks a little. :-) In any case, since this doesn’t effect a swing state, this doesn’t move the basic numbers of the race:
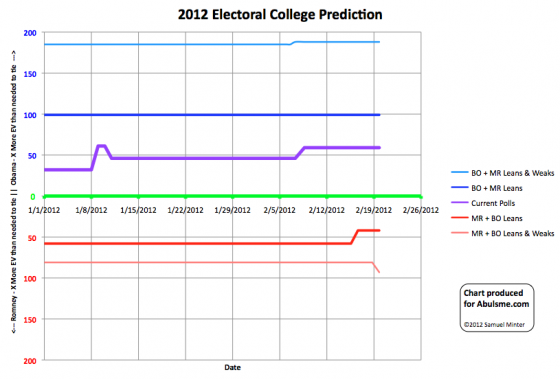
This is the first movement on our charts toward Romney since January 11th though, so that is worth noting. Chart from the Abulsme.com 2012 Electoral College Prediction page. Lines represent how many more electoral votes a candidate has than is needed to tie under several different scenarios. |
||||||||||||||

