Chart from the Abulsme.com 2012 Republican Delegate Count Graphs page.
Pulling ahead in just the last few days before the South Carolina Primary, Gingrich won a commanding victory in South Carolina. Although the congressional district level results won’t be final for awhile now, it looks like Gingrich will end up with 23 of South Carolina’s 25 delegates. Romney gets the remaining 2 delegates, plus he picked up another superdelegate since our last update.
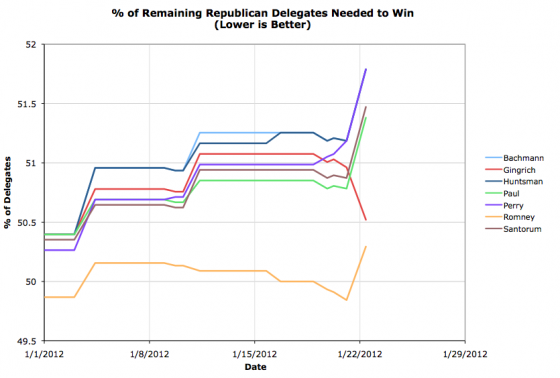
Fundamentally, looking at our “% of Remaining Delegates needed to win” chart gives the same story that is the big narrative tonight. This was a very bad day for Romney. Romney is still in the best position to win. He is still ahead in delegates. (33 Romney delegates to Gingrich’s 28 by our count which uses data from both The Green Papers and Democratic Convention Watch.) But now instead of being way off on his own, with a much better position than all of his competitors, who were getting worse off by the day, he is now joined by Gingrich, who has broken out of the pack of “not-Romneys” and is now nipping at Romney’s heels. Meanwhile, Paul and Santorum fall even further behind since they got no delegates at all out of South Carolina.
The next big contest is Florida of course, with 50 delegates at stake. Florida is a winner take all state. If Romney wins Florida, he pulls WAY ahead again, and pushes Gingrich back into the background. If Gingrich wins, then he suddenly will take a fairly significant lead himself, and we will need to start taking a much closer look at the rest of the calendar…
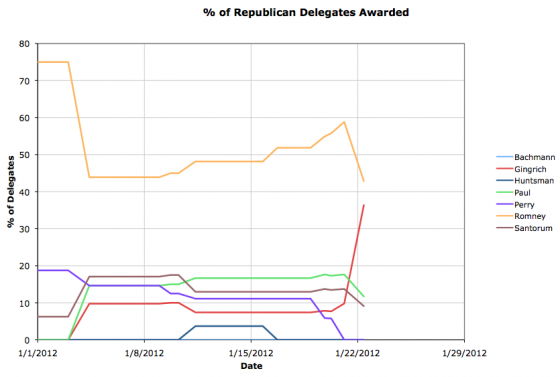
Since this was a big day, two other views as well… first the race as % of delegates captured so far…
Romney had been over 50% for a little while. No longer.
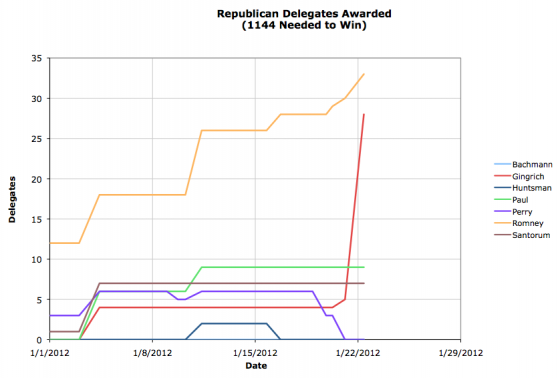
And finally, the plain old “Total Delegates” chart…
Gingrich’s good night is particularly striking in this last one, but I think it actually makes it look like a better night than it really was.
I think the first of these three charts is the most indicative of where the race really stands, but the other two are interesting views as well. But looking at % needed to win really gives you a sense of how close we are (or not) to wrapping things up. Numbers close to 50 as we have today still indicate a lot is possible. As we get candidates starting to head rapidly toward 100 (where they are mathematically eliminated) or starting to dive down toward zero (where they cinch the nomination) we will see very clearly the state of the race.


Leave a Reply
You must be logged in to post a comment.