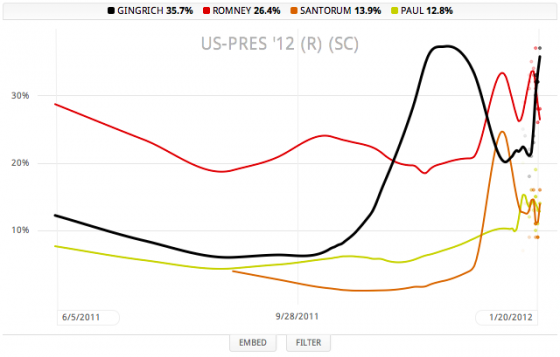
- MT @fivethirtyeight: Those new polls put Gingrich ahead in our SC forecast. Gingrich 62% chance of winning. http://t.co/VFzPe6pz #
- MT @wilw: MegaUpload had a lot of legitimate and legal uses and users. I'm not at all comfortable with the US government shutting it down. #
- RT @TPM: Gallup: Romney's support 'collapsing,' drops from a 23 point lead to 10 in six days http://t.co/OoTt1kBm ^@kyleleighton #
- Reading – Sweden Formally Recognizes File-Sharing as a Religion (Angela Moscaritolo) http://t.co/IKkgoZXF #
- Reading – Rumblings on the Newtrizon (Josh Marshall) http://t.co/AJjxpaYF #
- RT @donttrythis: Now it can be told! Our new sooper secret project is ready for prime time. http://t.co/XgUiKA8p #
- RT @fivethirtyeight: Gingrich up slightly to 64% chance of winning SC with that Clemson poll included in our forecast. http://t.co/VFzPe6pz #
- Reading – MegaUpload (Jonathan Coulton) http://t.co/0NPCVf6j #
- Watching – Star Wars Uncut: Director's Cut (ragingpugh) http://t.co/lAKa143j #
- Reading – Romney Campaign Braces For Crash Landing (Benjy Sarlin) http://t.co/slUMNCY1 #
- Reading – Newt Borrows From Romney’s Anti-Perry Strategy (Benjy Sarlin) http://t.co/8YYju54H #
- Reading – Chris Dodd to Obama: Hollywood will stop supporting you because you were soft on SOPA & PIPA (Cory Doctorow) http://t.co/4Fa9pAaJ #
- Reading – Two lessons from the Megaupload seizure (Glenn Greenwald) http://t.co/pQ0zLIqs http://t.co/PqcjFPN6 #
- Reading – RFS 9: Kill Hollywood (Y Combinator) http://t.co/z0CyJHCF #
- Reading – South Carolina Primary Overview and Forecast (Nate Silver) http://t.co/2uGyPIuq #
| Abulsme.com | Abulsme Blog | Election Graphs | Curmudgeon's Corner Podcast |
| True Binary Clock | Random Trips | Live WebCam |
|
Another good article on this sort of thing from Glenn Greenwald. This time looking at this in the context of SOPA and PIPA and how even without them the government ALREADY claims and exercises powers to shut down websites based on an accusation alone, not only after a proper advisory trial where the site gets to defend itself… see Megaupload this week. Just like the government claimed it has the powers explictly granted by the NDAA no matter if the law passed or not. Greenwald’s main point…
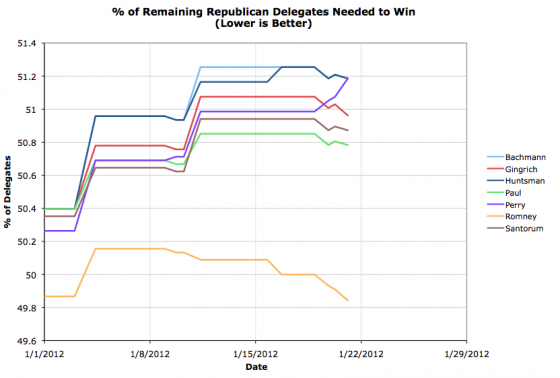
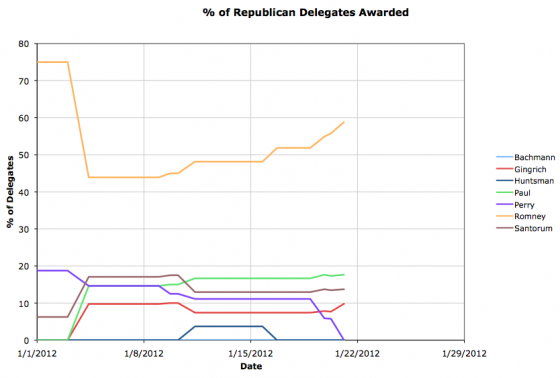
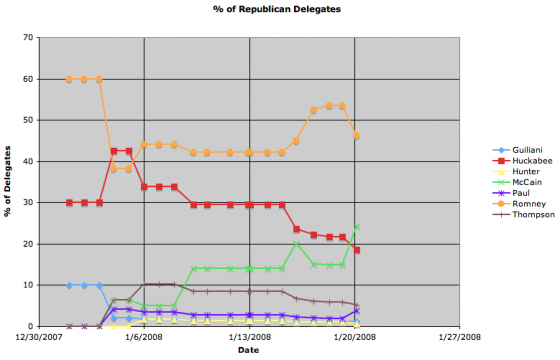
Amen. As usual, read the whole thing. BTW, this is totally nuts. Chart from TPM. Chart links to full article: Rumblings on the Newtrizon by Josh Marshall. So, as we approach the voting in South Carolina, a few delegate shuffles. Perry’s 3 projected delegates from Iowa get put back into the undetermined category, Gingrich gains one super delegate, and Romney gains one superdelegate. All in all this improves everybody’s position except Rick Perry, although it is best for Romney. So here we are. We’ll see what South Carolina does to all this. In the mean time though, lets do a quick look using a different view: This is the percentage of delegates each candidate has so far. Our Top 4 are: 58.8% Romney, 17.6% Paul, 13.7% Santorum, 9.8% Gingrich. But I wanted to compare, by looking at where we were four years ago. My most recent update post four years ago is here: Delegate Graphs with Preliminary Results from Nevada and South Carolina Republicans. Now, the primary schedule was a bit different, so there were already some results from South Carolina and Nevada, but where were we? What were the Top 4 back then? 46.2% Romney, 24.4% McCain, 18.6% Huckabee, 5.1% Thompson. That’s right, at this time in 2008, Romney was ahead in the delegate race. Romney. Not McCain. McCain had just had a big success in South Carolina, which was enough to pass Huckabee and start talk about him being the front runner and how Romney was vulnerable. McCain wouldn’t pass Romney in delegates until January 30th after Florida voted (and then he didn’t look back). So where we are on January 21st isn’t necessarily predictive of the final result. The dynamics are of course very different this time around. I just mention all this to point out that it is indeed still early. If Gingrich DOES pull out a major victory in South Carolina, taking the lion’s share of the delegates there, then that DOES change the dynamics of the race quite a bit. Romney still has a variety of systematic advantage even in that scenario, but it could make things more interesting for awhile longer! |
||
|
| ||


