- Reading – Progressives and the Ron Paul fallacies (Glenn Greenwald, Salon) http://t.co/GEqkYzrF #
- Reading – Why Ron Paul Challenges Liberals (Matt Stoller, Naked Capitalism) http://t.co/bbji4W7c #
- Reading – The Fight Goes On (The Bloggess) http://t.co/PUk5sqRs #
- Reading – Ron and Rand Paul, a double dose of liberty (Nia-Malika Henderson, Washington Post) http://t.co/W0QGaiBz #
- Reading – Crackpots Do Not Make Good Messengers (Kevin Drum, Mother Jones) http://t.co/TQBsTiSc #
- Reading – How many notes would a virtuoso violinist pay for a Stradivarius? (Ian Sample, Guardian) http://t.co/f4cAetra #
|
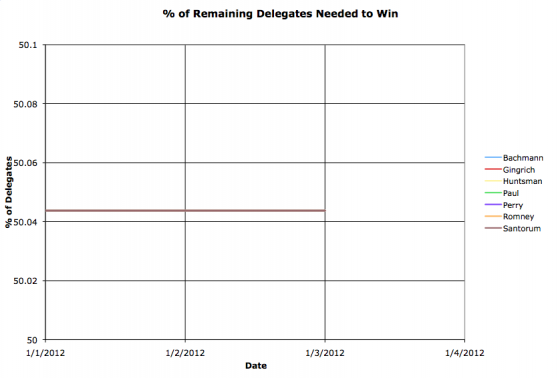
With mere hours left until the Iowa caucuses begin, it is time for election graphs! As with the last cycle, I will be producing updated graphs as the primary season goes on. I will post blog entries when there are significant updates, but the wiki page with all the details will always be on the AbulWiki at 2012 Presidential Delegate Graphs. You will find delegate counts everywhere as the days progress (assuming the Republican race doesn’t resolve itself nearly instantly) but the added value I think I have on my charts as opposed to elsewhere is that I will be concentrating on the percentage of remaining delegates needed to win outright. Last time around looking at the race this way rather than simply at delegate counts or percentage of delegates allocated so far let you see fairly clearly that Clinton’s chances against Obama had become essentially zero long before the general media finally admitted it. They hung on to the horserace story long past the point that the math made any Clinton catch up scenario reliant on incredible miracles. In any case, as of the best information I have at the moment, there will be 2286 delegates to the Republican National Convention. That means 1143 will give you a tie, but you will need 1144 for an outright win. So at the moment, prior to any delegates being awarded, each of the 7 major candidates still in the race need 50.044% percent of the outstanding delegates to win the Republican nomination. And the race is on! (Note 1: Since there is no significant challenger to Obama on the Democratic side, I’m not going to produce the graphs showing him marching inexorably to the nomination… if the no competition situation on the Democratic side changes unexpectedly, I’ll of course start to map out the race on that side too.) (Note 2: You may remember that last time around I did general election prediction charts based on the electoral college and state by state polling. These will be coming soon as well. Gulp. That was a lot of work last time around. :-) ) |
||
