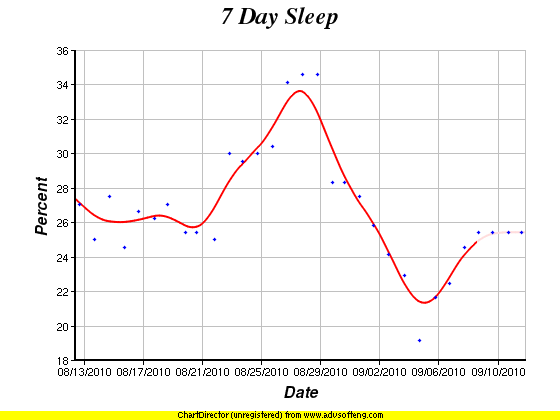
Dots are individual daily readings of the percent of time I spent asleep in the prior 7 days. The red line is a smoothed trend line (even though the points themselves are already smoothed by virtue of being over 7 days). I was on a “staycation” August 19th through 31st. The increase in time spent asleep is clearly visible.

Leave a Reply
You must be logged in to post a comment.