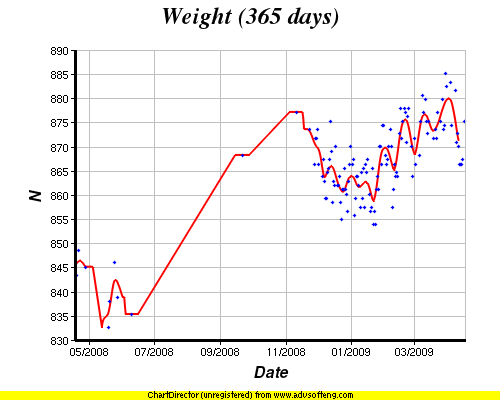
Well, I’ve finally done something I’ve been intending to do for years, but this weekend I got up a head of steam and just did it (sacrificing some sleep). That is, I’ve taken almost all of the various things that I generally track on a daily basis in Excel at home and moved them onto a lovely dashboard. It now has a place of honor on my top navbar as well for easy access.
There are two of my daily graphs that I haven’t yet ported over because they require a bit more computation (not much, just a little, and in a different way than all the rest, so they will have to wait). I’ll get to those eventually.
And there are still some others on my old graphs page that I haven’t updated in a long long time, that perhaps this will spur me to reactivate.
All in all, I’ve actually automated a bunch of the graphs so they will update without human intervention. Others to require me to do something each time I add a data point, but rather than putting data in an intermediate place to later put in excel, now the data will immediately go live online. So much less effort over all.
I still have a bunch of data in email (and even some older data on paper) that eventually will get backfilled into this. The charts have what was already in Excel.
Woo.
Anyway, I’m excited.
And tired.
