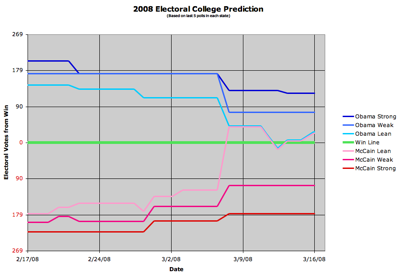
As I’ve been promising for awhile, I went ahead and adjusted how I am reporting results for the electoral college extrapolations. Previously, any lead by a candidate of less than 10% was simply classified “weak”. But a lot was obscured by that. So I now classify leads of less than 5% as “leaning” states, with 5% to 10% now being termed “weak”.
I have also added a “just the previous month” chart in addition to the chart showing the full year before the election. Changes can often be seen better at this scale.
In the end, what seems to be clear is just how up for grabs this election is. While if you include all the leaning states you end up with a McCain win (by about 293 to 245 at the moment), if you take into account the fact that any lead less than 5% is just barely outside the typical margin of error of polls, and is an amount that can clearly be erased overnight by changing events, what you actually see is that if the election was held today anything could happen between McCain winning by 76 electoral votes and Obama winning by 106 electoral votes. (On the chart this is represented by the area between the two “weak” lines.)
So anything could happen.
Not to mention of course that we are still seven and a half months from the election.
This will be a fun seven and a half months.

Leave a Reply
You must be logged in to post a comment.